
House Prices in Croydon
House prices in Croydon have an overall average of £419,328 over the last year.
The majority of properties sold in Croydon during the last year were flats, selling for an average price of £270,073. Terraced properties sold for an average of £444,434, with semi-detached properties fetching £545,676.
Overall, the historical sold prices in Croydon over the last year were 4% up on the previous year and 2% up on the 2022 peak of £409,662.
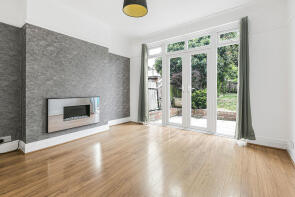
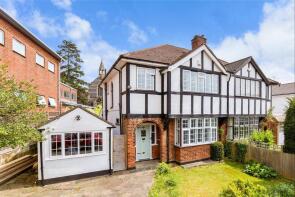
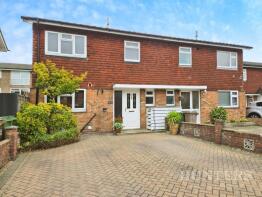
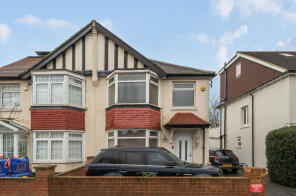
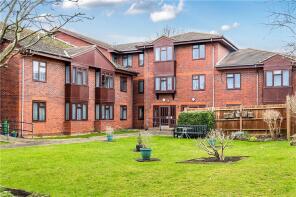
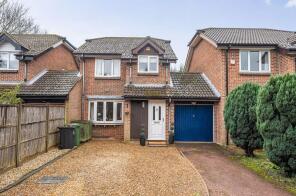
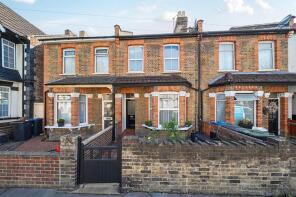
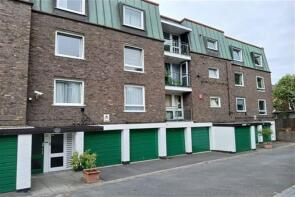
Properties Sold
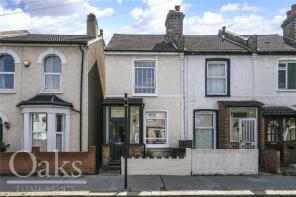
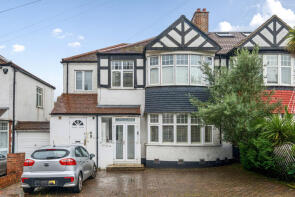
79, Selsdon Road, South Croydon CR2 6PZ

| Today | See what it's worth now |
| 30 Apr 2026 | £480,000 |
| 27 Feb 2015 | £335,000 |
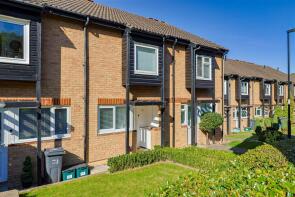
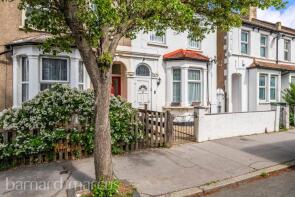
52, Croham Valley Road, South Croydon CR2 7NB
| Today | See what it's worth now |
| 28 Apr 2026 | £865,000 |
| 27 Apr 2011 | £570,000 |
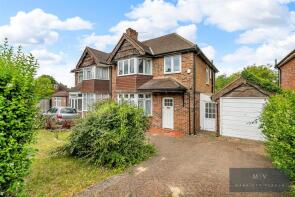
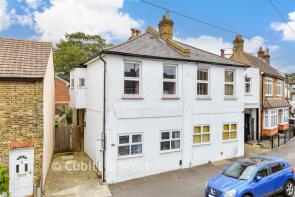
87, Church Street, Croydon CR0 1RN

| Today | See what it's worth now |
| 24 Apr 2026 | £200,000 |
| 14 Feb 2023 | £195,000 |
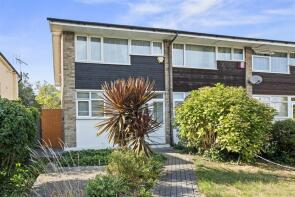
4, Greenway Drive, Croydon CR0 8FA
| Today | See what it's worth now |
| 23 Apr 2026 | £700,000 |
No other historical records.
61, Grasmere Road, South Norwood, London SE25 4RQ
| Today | See what it's worth now |
| 23 Apr 2026 | £480,000 |
| 21 Mar 2022 | £405,000 |
No other historical records.
3, Lyndhurst Close, Croydon CR0 5LU
| Today | See what it's worth now |
| 20 Apr 2026 | £675,000 |
| 13 Oct 2014 | £485,110 |
No other historical records.
169b, Davidson Road, Croydon CR0 6DP
| Today | See what it's worth now |
| 17 Apr 2026 | £320,000 |
| 12 Nov 2021 | £305,000 |
31, Grange Road, South Croydon CR2 0NE
| Today | See what it's worth now |
| 16 Apr 2026 | £465,000 |
| 7 Sep 2007 | £248,000 |
No other historical records.
20, Rockhampton Road, South Croydon CR2 7AQ
| Today | See what it's worth now |
| 14 Apr 2026 | £710,000 |
| 3 Sep 2018 | £545,000 |
No other historical records.
6, Richmond Green, Beddington CR0 4SA
| Today | See what it's worth now |
| 13 Apr 2026 | £450,000 |
No other historical records.
129, Northway Road, Croydon CR0 6JJ
| Today | See what it's worth now |
| 13 Apr 2026 | £445,000 |
| 13 Feb 2009 | £230,000 |
1, 61 63 Catalina Court, Sunny Bank, South Norwood, London SE25 4TZ
| Today | See what it's worth now |
| 10 Apr 2026 | £95,000 |
| 14 Feb 2023 | £177,000 |
39, Blackford Close, South Croydon CR2 6BT
| Today | See what it's worth now |
| 10 Apr 2026 | £500,000 |
| 6 Aug 2010 | £325,000 |
6, Stretton Road, Croydon CR0 6EN
| Today | See what it's worth now |
| 10 Apr 2026 | £495,000 |
| 25 Jan 2019 | £421,000 |
Flat 7, 113 Oaklands, Haling Park Road, South Croydon CR2 6NN
| Today | See what it's worth now |
| 10 Apr 2026 | £172,500 |
| 18 Feb 2000 | £53,500 |
13, Elmers Road, South Norwood, London SE25 5DS
| Today | See what it's worth now |
| 10 Apr 2026 | £406,000 |
| 11 Jul 2019 | £295,000 |
No other historical records.
43, Capri Road, Croydon CR0 6LG

| Today | See what it's worth now |
| 10 Apr 2026 | £450,000 |
| 24 Jan 2022 | £460,000 |
No other historical records.
21, Whitmead Close, South Croydon CR2 7AS
| Today | See what it's worth now |
| 9 Apr 2026 | £400,000 |
| 13 Nov 2020 | £315,000 |
No other historical records.
Flat 11, 22 Pump House, Station Road, South Norwood, London SE25 5FJ

| Today | See what it's worth now |
| 9 Apr 2026 | £320,000 |
| 9 Oct 2020 | £183,000 |
No other historical records.
38, Crest Road, South Croydon CR2 7JQ
| Today | See what it's worth now |
| 9 Apr 2026 | £620,000 |
| 20 Mar 1996 | £112,000 |
No other historical records.
1, The Maltings, Whitehorse Lane, South Norwood, London SE25 6UJ
| Today | See what it's worth now |
| 8 Apr 2026 | £440,000 |
| 23 Oct 1998 | £80,000 |
No other historical records.
68, Addiscombe Court Road, Croydon CR0 6TQ

| Today | See what it's worth now |
| 7 Apr 2026 | £475,000 |
| 13 May 2010 | £300,000 |
48a, Southern Avenue, South Norwood, London SE25 4BS
| Today | See what it's worth now |
| 7 Apr 2026 | £400,000 |
| 14 Oct 2022 | £372,000 |
Source Acknowledgement: © Crown copyright. England and Wales house price data is publicly available information produced by the HM Land Registry.This material was last updated on 9 July 2026. It covers the period from 1 January 1995 to 30 April 2026 and contains property transactions which have been registered during that period. Contains HM Land Registry data © Crown copyright and database right 2026. This data is licensed under the Open Government Licence v3.0.
Disclaimer: Rightmove.co.uk provides this HM Land Registry data "as is". The burden for fitness of the data relies completely with the user and is provided for informational purposes only. No warranty, express or implied, is given relating to the accuracy of content of the HM Land Registry data and Rightmove does not accept any liability for error or omission. If you have found an error with the data or need further information please contact HM Land Registry.
Permitted Use: Viewers of this Information are granted permission to access this Crown copyright material and to download it onto electronic, magnetic, optical or similar storage media provided that such activities are for private research, study or in-house use only. Any other use of the material requires the formal written permission of Land Registry which can be requested from us, and is subject to an additional licence and associated charge.
Rightmove takes no liability for your use of, or reliance on, Rightmove's Instant Valuation due to the limitations of our tracking tool listed here. Use of this tool is taken entirely at your own risk. All rights reserved.