
House Prices in New Osney
House prices in New Osney have an overall average of £451,120 over the last year.
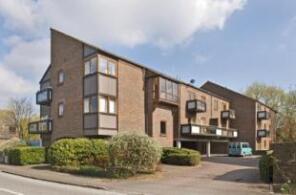
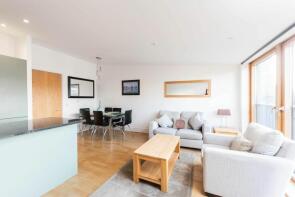
The majority of properties sold in New Osney during the last year were flats, selling for an average price of £387,667. Terraced properties sold for an average of £627,500, with semi-detached properties fetching £535,000.
Overall, the historical sold prices in New Osney over the last year were 19% down on the previous year and 16% down on the 2021 peak of £535,133.
Properties Sold
Flat 60, The Lion Brewery, St Thomas Street, Oxford OX1 1JE

| Today | See what it's worth now |
| 19 Dec 2025 | £430,000 |
| 26 Feb 2004 | £195,000 |
No other historical records.
Flat 10, 1 Rivercourt, Trinity Street, Oxford OX1 1TQ
| Today | See what it's worth now |
| 14 Nov 2025 | £350,000 |
| 30 Jun 2010 | £187,500 |
78, Thames Street, Oxford OX1 1SU
| Today | See what it's worth now |
| 11 Nov 2025 | £610,000 |
| 17 Dec 2019 | £480,000 |
Flat 43, The Lion Brewery, St Thomas Street, Oxford OX1 1JE
| Today | See what it's worth now |
| 31 Oct 2025 | £495,000 |
| 17 Nov 2004 | £260,000 |
No other historical records.
8, Stable Close, Oxford OX1 2RF
| Today | See what it's worth now |
| 24 Oct 2025 | £540,000 |
| 24 Apr 2009 | £245,000 |
12, Sadler Walk, Oxford OX1 1TX
| Today | See what it's worth now |
| 29 Sep 2025 | £665,000 |
| 31 Jan 2014 | £410,000 |
7, Marlborough Road, Oxford OX1 4LW
| Today | See what it's worth now |
| 24 Sep 2025 | £850,000 |
| 15 Dec 2010 | £445,000 |
24, The Stream Edge, Fisher Row, Oxford OX1 1HT
| Today | See what it's worth now |
| 23 Sep 2025 | £378,000 |
| 6 Jun 2014 | £303,000 |
21, The Stream Edge, Fisher Row, Oxford OX1 1HT
| Today | See what it's worth now |
| 15 Sep 2025 | £375,000 |
| 9 Sep 2005 | £183,000 |
No other historical records.
Flat 1, Staincross House, Albion Place, Oxford OX1 1SG
| Today | See what it's worth now |
| 29 Aug 2025 | £250,000 |
No other historical records.
80, Rowland Hill Court, Osney Lane, Oxford OX1 1LF
| Today | See what it's worth now |
| 7 Aug 2025 | £390,000 |
| 10 Feb 2006 | £217,000 |
Flat 6, Rivercourt, Trinity Street, Oxford OX1 1TQ

| Today | See what it's worth now |
| 27 Jun 2025 | £300,000 |
No other historical records.
Flat 18, Tennyson Lodge, Paradise Square, Oxford OX1 1UD
| Today | See what it's worth now |
| 20 Jun 2025 | £445,000 |
| 23 May 2002 | £172,500 |
8, Shirelake Close, Oxford OX1 1SN
| Today | See what it's worth now |
| 19 Jun 2025 | £420,000 |
| 19 Jun 2025 | £420,000 |
No other historical records.
18, Folly Bridge Court, Shirelake Close, Oxford OX1 1SW
| Today | See what it's worth now |
| 16 Jun 2025 | £286,000 |
| 9 Jul 2010 | £167,000 |
6, Rickyard Close, Oxford OX1 2RE
| Today | See what it's worth now |
| 12 Jun 2025 | £500,000 |
| 14 Dec 2015 | £475,000 |
79, Rewley Road, Oxford OX1 2RQ
| Today | See what it's worth now |
| 6 Jun 2025 | £407,000 |
| 29 Oct 1999 | £118,500 |
No other historical records.
13a, Upper Fisher Row, Oxford OX1 2EZ


| Today | See what it's worth now |
| 9 May 2025 | £700,000 |
No other historical records.
46, Folly Bridge Court, Shirelake Close, Oxford OX1 1SW

| Today | See what it's worth now |
| 17 Apr 2025 | £257,000 |
No other historical records.
16, Thames Street, Oxford OX1 1TS
| Today | See what it's worth now |
| 31 Mar 2025 | £400,000 |
| 6 Nov 2013 | £355,000 |
No other historical records.
3, Tidmarsh Lane, Oxford OX1 1AZ
| Today | See what it's worth now |
| 28 Mar 2025 | £455,000 |
| 24 Mar 2006 | £255,000 |
No other historical records.
12, Oxford Castle, New Road, Oxford OX1 1AY
| Today | See what it's worth now |
| 27 Mar 2025 | £380,000 |
No other historical records.
5, Paradise Square, Oxford OX1 1TW
| Today | See what it's worth now |
| 26 Mar 2025 | £535,000 |
| 1 Aug 2000 | £167,500 |
5, Rowland Hill Court, Osney Lane, Oxford OX1 1LE
| Today | See what it's worth now |
| 17 Mar 2025 | £440,000 |
| 18 May 2001 | £205,995 |
No other historical records.
2, Baltic Wharf, Marlborough Road, Oxford OX1 4JX
| Today | See what it's worth now |
| 27 Jan 2025 | £705,000 |
| 11 Dec 1998 | £195,000 |
No other historical records.
Source Acknowledgement: © Crown copyright. England and Wales house price data is publicly available information produced by the HM Land Registry.This material was last updated on 4 February 2026. It covers the period from 1 January 1995 to 24 December 2025 and contains property transactions which have been registered during that period. Contains HM Land Registry data © Crown copyright and database right 2026. This data is licensed under the Open Government Licence v3.0.
Disclaimer: Rightmove.co.uk provides this HM Land Registry data "as is". The burden for fitness of the data relies completely with the user and is provided for informational purposes only. No warranty, express or implied, is given relating to the accuracy of content of the HM Land Registry data and Rightmove does not accept any liability for error or omission. If you have found an error with the data or need further information please contact HM Land Registry.
Permitted Use: Viewers of this Information are granted permission to access this Crown copyright material and to download it onto electronic, magnetic, optical or similar storage media provided that such activities are for private research, study or in-house use only. Any other use of the material requires the formal written permission of Land Registry which can be requested from us, and is subject to an additional licence and associated charge.
Map data ©OpenStreetMap contributors.
Rightmove takes no liability for your use of, or reliance on, Rightmove's Instant Valuation due to the limitations of our tracking tool listed here. Use of this tool is taken entirely at your own risk. All rights reserved.