
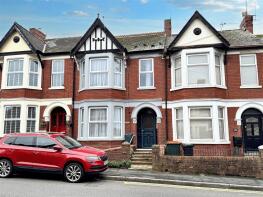
House Prices in Newport (district of)
House prices in Newport (district of) have an overall average of £256,927 over the last year.
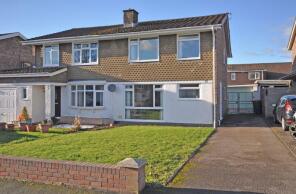
The majority of properties sold in Newport (district of) during the last year were terraced properties, selling for an average price of £188,584. Semi-detached properties sold for an average of £252,829, with detached properties fetching £400,063.
Overall, the historical sold prices in Newport (district of) over the last year were similar to the previous year and 5% up on the 2023 peak of £244,875.
Properties Sold
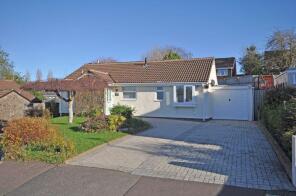
35, Edward German Crescent, Newport NP19 9ND

| Today | See what it's worth now |
| 16 Apr 2026 | £190,000 |
| 9 Dec 2021 | £150,000 |
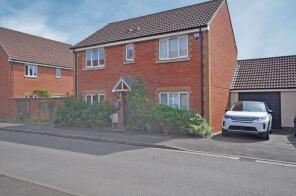
18, Sunnybank, Bassaleg, Newport NP10 8JP
| Today | See what it's worth now |
| 15 Apr 2026 | £350,000 |
| 8 Aug 2019 | £236,000 |
No other historical records.
51, Bloomery Circle, Newport NP19 4TR
| Today | See what it's worth now |
| 15 Apr 2026 | £320,000 |
| 29 Jun 2012 | £220,000 |
No other historical records.
37, Thornhill Way, Rogerstone, Newport NP10 9FS
| Today | See what it's worth now |
| 13 Apr 2026 | £275,000 |
| 16 Dec 2020 | £220,000 |
No other historical records.
7, Friars Court, Newport NP20 4ET
| Today | See what it's worth now |
| 10 Apr 2026 | £107,000 |
| 30 May 1997 | £30,000 |
No other historical records.
4, Nant Coch Rise, Newport NP20 3SG
| Today | See what it's worth now |
| 10 Apr 2026 | £617,500 |
| 22 Dec 2005 | £424,000 |
No other historical records.
3, Rhymney Way, Bassaleg, Newport NP10 8FP
| Today | See what it's worth now |
| 10 Apr 2026 | £267,500 |
| 10 Jan 2020 | £214,000 |
2, Hen Chwarel Drive, Newport NP18 2EJ
| Today | See what it's worth now |
| 10 Apr 2026 | £418,000 |
| 20 Dec 2019 | £334,995 |
No other historical records.
16, Michaelmas Close, Rogerstone, Newport NP10 9LU
| Today | See what it's worth now |
| 10 Apr 2026 | £315,000 |
| 8 Jun 2018 | £229,950 |
No other historical records.
63, Coldra Road, Newport NP20 4FF
| Today | See what it's worth now |
| 10 Apr 2026 | £207,500 |
| 8 Oct 2015 | £110,000 |
No other historical records.
61, Myrtle Drive, Rogerstone, Newport NP10 9EA

| Today | See what it's worth now |
| 10 Apr 2026 | £208,000 |
| 6 Apr 2022 | £186,000 |
1, Poplar Court, Caerleon, Newport NP18 3EB
| Today | See what it's worth now |
| 10 Apr 2026 | £300,000 |
| 31 Aug 2007 | £210,000 |
22, Campanula Drive, Rogerstone, Newport NP10 9JG
| Today | See what it's worth now |
| 10 Apr 2026 | £370,000 |
| 1 Jun 2001 | £112,995 |
No other historical records.
41, Greenmeadow Road, Newport NP19 4LQ
| Today | See what it's worth now |
| 10 Apr 2026 | £230,000 |
| 7 May 2004 | £105,000 |
No other historical records.
41, Keene Avenue, Rogerstone, Newport NP10 9DF

| Today | See what it's worth now |
| 10 Apr 2026 | £210,000 |
| 14 Nov 2024 | £122,000 |
24, Tadia Way, Caerleon, Newport NP18 3PG
| Today | See what it's worth now |
| 9 Apr 2026 | £410,000 |
| 26 May 2017 | £300,000 |
No other historical records.
108, The Moorings, Newport NP19 7JL
| Today | See what it's worth now |
| 8 Apr 2026 | £254,500 |
| 27 Jul 2007 | £177,000 |
15, Lysaght Way, Newport NP19 4AL
| Today | See what it's worth now |
| 3 Apr 2026 | £225,000 |
| 21 Dec 2018 | £173,995 |
No other historical records.
52, Balmoral Road, Newport NP19 8JR
| Today | See what it's worth now |
| 2 Apr 2026 | £185,000 |
| 1 Dec 2023 | £173,500 |
No other historical records.
22, Downing Street, Newport NP19 0JJ
| Today | See what it's worth now |
| 2 Apr 2026 | £163,500 |
| 6 Mar 1998 | £37,500 |
24, Granville Close, Rogerstone, Newport NP10 9BP

| Today | See what it's worth now |
| 2 Apr 2026 | £210,000 |
| 30 May 2025 | £175,000 |
12, Livingstone Place, Newport NP19 8EY

| Today | See what it's worth now |
| 2 Apr 2026 | £145,000 |
| 11 Mar 2005 | £82,000 |
No other historical records.
7, Viscountess Rhondda House, Anderson Grove, Newport NP19 4DB

| Today | See what it's worth now |
| 2 Apr 2026 | £147,000 |
| 8 Oct 2021 | £125,000 |

Source Acknowledgement: © Crown copyright. England and Wales house price data is publicly available information produced by the HM Land Registry.This material was last updated on 9 July 2026. It covers the period from 1 January 1995 to 30 April 2026 and contains property transactions which have been registered during that period. Contains HM Land Registry data © Crown copyright and database right 2026. This data is licensed under the Open Government Licence v3.0.
Disclaimer: Rightmove.co.uk provides this HM Land Registry data "as is". The burden for fitness of the data relies completely with the user and is provided for informational purposes only. No warranty, express or implied, is given relating to the accuracy of content of the HM Land Registry data and Rightmove does not accept any liability for error or omission. If you have found an error with the data or need further information please contact HM Land Registry.
Permitted Use: Viewers of this Information are granted permission to access this Crown copyright material and to download it onto electronic, magnetic, optical or similar storage media provided that such activities are for private research, study or in-house use only. Any other use of the material requires the formal written permission of Land Registry which can be requested from us, and is subject to an additional licence and associated charge.
Rightmove takes no liability for your use of, or reliance on, Rightmove's Instant Valuation due to the limitations of our tracking tool listed here. Use of this tool is taken entirely at your own risk. All rights reserved.