
House Prices in Ningwood Common
House prices in Ningwood Common have an overall average of £377,683 over the last year.
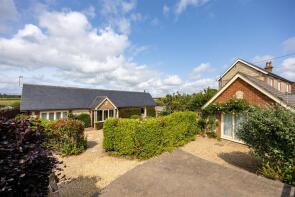
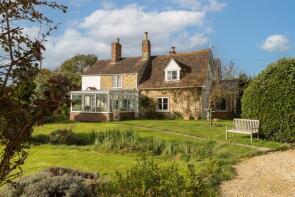
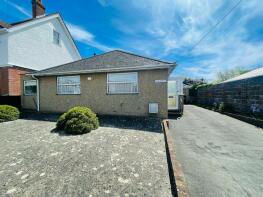
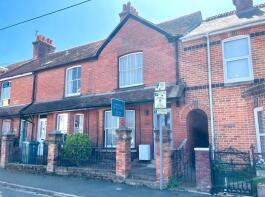
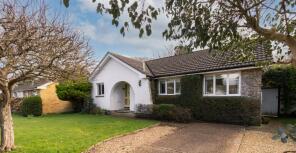
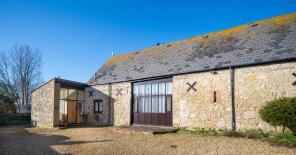
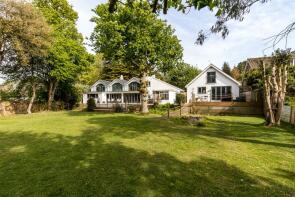
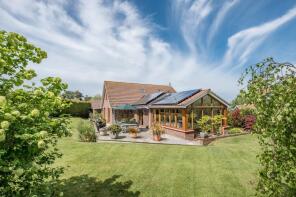
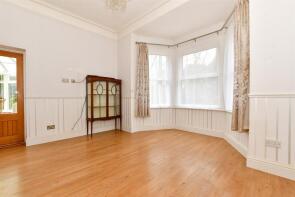
The majority of properties sold in Ningwood Common during the last year were detached properties, selling for an average price of £475,242. Semi-detached properties sold for an average of £254,000, with flats fetching £178,750.
Overall, the historical sold prices in Ningwood Common over the last year were 25% down on the previous year and 36% down on the 2022 peak of £594,624.
Properties Sold
Longwood, Hammond Close, Yarmouth PO41 0RP
| Today | See what it's worth now |
| 10 Feb 2026 | £595,000 |
| 10 Aug 2020 | £343,000 |
Omdurman, South Street, Yarmouth PO41 0QD
| Today | See what it's worth now |
| 21 Nov 2025 | £258,198 |
No other historical records.
2, The Vineyard, Yarmouth PO41 0XE
| Today | See what it's worth now |
| 22 Oct 2025 | £128,000 |
| 29 Mar 2011 | £137,000 |
1, Tides Reach, Mill Road, Yarmouth PO41 0QZ
| Today | See what it's worth now |
| 21 Oct 2025 | £205,000 |
No other historical records.
Lime Barn, Main Road, Yarmouth PO41 0SZ
| Today | See what it's worth now |
| 21 Oct 2025 | £675,000 |
| 23 Feb 2012 | £417,500 |
Wellow Cottage, Main Road, Yarmouth PO41 0TE
| Today | See what it's worth now |
| 30 Sep 2025 | £575,000 |
| 27 Jun 2014 | £495,000 |
The Haven, Tennyson Road, Yarmouth PO41 0PX
| Today | See what it's worth now |
| 29 Sep 2025 | £300,000 |
No other historical records.
Hawthorn, Ommanney Road, Yarmouth PO41 0QA
| Today | See what it's worth now |
| 29 Aug 2025 | £340,000 |
No other historical records.
4, Braxton Meadow, Yarmouth PO41 0RN
| Today | See what it's worth now |
| 20 Aug 2025 | £433,493 |
| 28 Jul 1999 | £104,000 |
No other historical records.
Delphis, Station Road, Newport PO30 4NL
| Today | See what it's worth now |
| 8 Aug 2025 | £380,000 |
| 24 Jan 2008 | £310,000 |
Windward, St James Street, Yarmouth PO41 0NU

| Today | See what it's worth now |
| 25 Jul 2025 | £490,000 |
| 30 Jul 2014 | £281,250 |
32, The Vineyard, Yarmouth PO41 0XE
| Today | See what it's worth now |
| 4 Jul 2025 | £152,500 |
| 4 Mar 2006 | £142,500 |
No other historical records.
Holmfield, Holmfield Avenue, Thorley, Yarmouth PO41 0ST
| Today | See what it's worth now |
| 30 Jun 2025 | £430,000 |
| 12 Nov 2020 | £395,000 |
Old Barn House, Station Road, Newport PO30 4NJ
| Today | See what it's worth now |
| 27 Jun 2025 | £545,000 |
| 28 Mar 2006 | £315,000 |
No other historical records.
Norton Cottage, Halletts Shute, Yarmouth PO41 0SB
| Today | See what it's worth now |
| 19 Jun 2025 | £803,000 |
| 12 Nov 2020 | £920,000 |
Jumbles, Port La Salle, Yarmouth PO41 0XD
| Today | See what it's worth now |
| 18 Jun 2025 | £820,000 |
| 11 Dec 2018 | £665,000 |
Tree Tops, Solent Road, Yarmouth PO41 0XY

| Today | See what it's worth now |
| 30 May 2025 | £425,000 |
| 16 Mar 2015 | £225,000 |
No other historical records.
2, Clevelands, Alexandra Road East, Yarmouth PO41 0UZ
| Today | See what it's worth now |
| 16 May 2025 | £185,000 |
| 20 Nov 2020 | £185,000 |
The Pump House, Mill Road, Yarmouth PO41 0QZ

| Today | See what it's worth now |
| 9 May 2025 | £675,000 |
| 23 Sep 2022 | £549,200 |
No other historical records.
7, Braxton Meadow, Yarmouth PO41 0RN

| Today | See what it's worth now |
| 31 Mar 2025 | £415,000 |
| 5 Apr 2004 | £249,980 |
No other historical records.
5, Tides Reach, Mill Road, Yarmouth PO41 0QZ
| Today | See what it's worth now |
| 31 Mar 2025 | £220,000 |
| 11 Aug 2015 | £172,000 |
No other historical records.
Amulet, Bouldnor Road, Yarmouth PO41 0UR
| Today | See what it's worth now |
| 28 Mar 2025 | £875,000 |
| 2 Mar 2012 | £500,000 |
3, Wellington Square, Yarmouth PO41 0LB
| Today | See what it's worth now |
| 28 Mar 2025 | £399,950 |
| 3 Apr 2012 | £317,500 |
Source Acknowledgement: © Crown copyright. England and Wales house price data is publicly available information produced by the HM Land Registry.This material was last updated on 9 July 2026. It covers the period from 1 January 1995 to 30 April 2026 and contains property transactions which have been registered during that period. Contains HM Land Registry data © Crown copyright and database right 2026. This data is licensed under the Open Government Licence v3.0.
Disclaimer: Rightmove.co.uk provides this HM Land Registry data "as is". The burden for fitness of the data relies completely with the user and is provided for informational purposes only. No warranty, express or implied, is given relating to the accuracy of content of the HM Land Registry data and Rightmove does not accept any liability for error or omission. If you have found an error with the data or need further information please contact HM Land Registry.
Permitted Use: Viewers of this Information are granted permission to access this Crown copyright material and to download it onto electronic, magnetic, optical or similar storage media provided that such activities are for private research, study or in-house use only. Any other use of the material requires the formal written permission of Land Registry which can be requested from us, and is subject to an additional licence and associated charge.
Rightmove takes no liability for your use of, or reliance on, Rightmove's Instant Valuation due to the limitations of our tracking tool listed here. Use of this tool is taken entirely at your own risk. All rights reserved.