
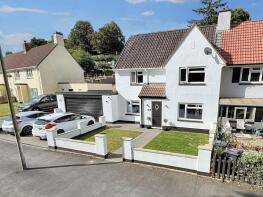
House Prices in Oakford Bridge
House prices in Oakford Bridge have an overall average of £388,643 over the last year.
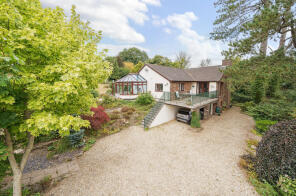
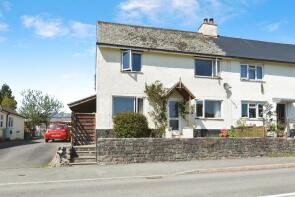
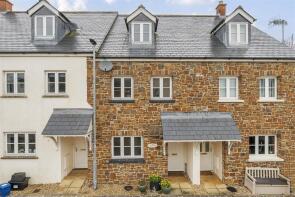
The majority of properties sold in Oakford Bridge during the last year were detached properties, selling for an average price of £540,000. Semi-detached properties sold for an average of £292,300, with terraced properties fetching £313,750.
Overall, the historical sold prices in Oakford Bridge over the last year were 4% down on the previous year and 9% down on the 2021 peak of £426,469.
Properties Sold
9, Bourchier Close, Tiverton EX16 9AG

| Today | See what it's worth now |
| 7 Apr 2026 | £235,000 |
| 24 Mar 2000 | £77,000 |
No other historical records.
6, Frog Street, Bampton EX16 9NT

| Today | See what it's worth now |
| 2 Apr 2026 | £207,500 |
| 14 Dec 2018 | £170,000 |
1, Bourchier Close, Tiverton EX16 9AG
| Today | See what it's worth now |
| 27 Mar 2026 | £280,000 |
| 27 Feb 2008 | £212,500 |
1, Town Mead, Road From Pinkworthy Cross To Stuckeridge Cross, Tiverton EX16 9EW
| Today | See what it's worth now |
| 27 Mar 2026 | £280,000 |
| 5 May 2006 | £175,000 |
1, Ashleigh Park, Tiverton EX16 9LF

| Today | See what it's worth now |
| 19 Mar 2026 | £460,000 |
| 11 Feb 2003 | £294,000 |
No other historical records.
Coxhayes, Frog Street, Tiverton EX16 9NT
| Today | See what it's worth now |
| 26 Feb 2026 | £260,000 |
| 30 Nov 2017 | £210,000 |
7, South Molton Road, Bampton EX16 9NH
| Today | See what it's worth now |
| 26 Feb 2026 | £278,000 |
No other historical records.
14, School Close, Tiverton EX16 9NN
| Today | See what it's worth now |
| 30 Jan 2026 | £320,000 |
| 27 Mar 2020 | £180,000 |
No other historical records.
1, Lords Meadow Lane, Tiverton EX16 9NY
| Today | See what it's worth now |
| 30 Jan 2026 | £475,000 |
| 4 Jul 2014 | £380,000 |
Upside, High Street, Tiverton EX16 9NQ
| Today | See what it's worth now |
| 15 Jan 2026 | £465,000 |
| 29 Oct 2009 | £325,000 |
No other historical records.
Old Quarry Stables, Tiverton Road, Tiverton EX16 9LJ
| Today | See what it's worth now |
| 15 Jan 2026 | £243,000 |
| 17 Dec 2013 | £250,000 |
No other historical records.
1, Magnolia Villas, Briton Street, Tiverton EX16 9LL
| Today | See what it's worth now |
| 12 Jan 2026 | £350,000 |
| 11 Jan 2016 | £200,000 |
The Pines, High Street, Tiverton EX16 9NQ
| Today | See what it's worth now |
| 7 Jan 2026 | £560,000 |
| 18 Dec 1996 | £150,000 |
No other historical records.
8, Bourchier Close, Tiverton EX16 9AG

| Today | See what it's worth now |
| 17 Dec 2025 | £330,000 |
| 17 Jun 2016 | £198,000 |
Primrose Cottage, Road Heading Southeast From Exeter Inn Cross, Tiverton EX16 9EA
| Today | See what it's worth now |
| 17 Dec 2025 | £250,000 |
| 7 Aug 2014 | £157,000 |
3, Banfields, Tiverton EX16 9BA
| Today | See what it's worth now |
| 8 Dec 2025 | £200,000 |
| 29 Apr 2009 | £130,000 |
Pylemoor Barn, Washfield EX16 9RF
| Today | See what it's worth now |
| 5 Dec 2025 | £655,000 |
No other historical records.
9, Newton Court, Tiverton EX16 9LG
| Today | See what it's worth now |
| 24 Nov 2025 | £255,000 |
| 16 Dec 2005 | £195,500 |
No other historical records.
Littlebrook Cottage, Frog Street, Tiverton EX16 9NT
| Today | See what it's worth now |
| 17 Nov 2025 | £340,000 |
| 20 Mar 2014 | £228,000 |
Lower Bowbier, Bampton EX16 9EE
| Today | See what it's worth now |
| 7 Nov 2025 | £1,100,000 |
No other historical records.
1, Morrells Cross, Morebath EX16 9DA
| Today | See what it's worth now |
| 10 Oct 2025 | £200,000 |
| 22 Feb 2006 | £182,000 |
No other historical records.
The Oaks, South Molton Road, Tiverton EX16 9HU
| Today | See what it's worth now |
| 3 Sep 2025 | £882,000 |
| 15 Nov 2011 | £250,000 |
No other historical records.
6, Woodland Close, Tiverton EX16 9DN
| Today | See what it's worth now |
| 29 Aug 2025 | £136,500 |
| 7 Feb 2017 | £122,000 |

Source Acknowledgement: © Crown copyright. England and Wales house price data is publicly available information produced by the HM Land Registry.This material was last updated on 9 July 2026. It covers the period from 1 January 1995 to 30 April 2026 and contains property transactions which have been registered during that period. Contains HM Land Registry data © Crown copyright and database right 2026. This data is licensed under the Open Government Licence v3.0.
Disclaimer: Rightmove.co.uk provides this HM Land Registry data "as is". The burden for fitness of the data relies completely with the user and is provided for informational purposes only. No warranty, express or implied, is given relating to the accuracy of content of the HM Land Registry data and Rightmove does not accept any liability for error or omission. If you have found an error with the data or need further information please contact HM Land Registry.
Permitted Use: Viewers of this Information are granted permission to access this Crown copyright material and to download it onto electronic, magnetic, optical or similar storage media provided that such activities are for private research, study or in-house use only. Any other use of the material requires the formal written permission of Land Registry which can be requested from us, and is subject to an additional licence and associated charge.
Rightmove takes no liability for your use of, or reliance on, Rightmove's Instant Valuation due to the limitations of our tracking tool listed here. Use of this tool is taken entirely at your own risk. All rights reserved.