
House Prices in Oakwood
House prices in Oakwood have an overall average of £257,676 over the last year.
The majority of properties sold in Oakwood during the last year were detached properties, selling for an average price of £350,502. Semi-detached properties sold for an average of £202,098, with terraced properties fetching £167,155.
Overall, the historical sold prices in Oakwood over the last year were 2% up on the previous year and 3% up on the 2022 peak of £251,114.
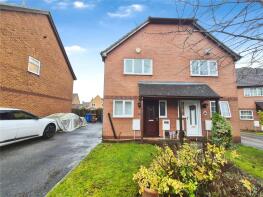
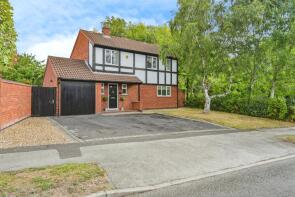
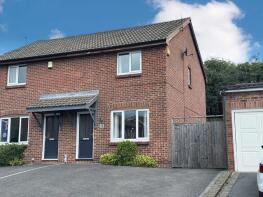
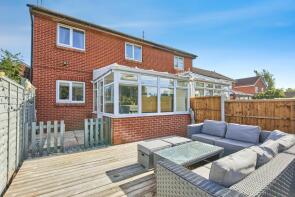
Properties Sold
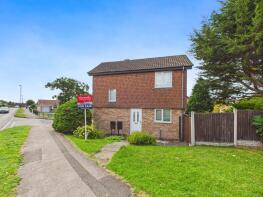
9, Sedgebrook Close, Derby DE21 2DX
| Today | See what it's worth now |
| 24 Apr 2026 | £175,000 |
| 23 Sep 2005 | £117,000 |
No other historical records.
58, Hare Edge Drive, Derby DE21 2AF
| Today | See what it's worth now |
| 17 Apr 2026 | £245,000 |
| 30 Jul 2021 | £207,000 |
No other historical records.
22, Wayfaring Road, Derby DE21 2TA
| Today | See what it's worth now |
| 17 Apr 2026 | £205,000 |
| 18 Nov 2021 | £188,000 |
16, Gilderdale Way, Derby DE21 2SY

| Today | See what it's worth now |
| 14 Apr 2026 | £77,000 |
| 3 Jun 2021 | £231,000 |
13, Meadowlark Grove, Derby DE21 2TT

| Today | See what it's worth now |
| 31 Mar 2026 | £139,000 |
| 28 Jun 2013 | £91,000 |
35, Caldermill Drive, Derby DE21 2UB
| Today | See what it's worth now |
| 27 Mar 2026 | £176,500 |
| 12 Apr 2013 | £116,000 |
17, Northacre Road, Derby DE21 2TN
| Today | See what it's worth now |
| 27 Mar 2026 | £185,100 |
| 27 Jul 2012 | £116,500 |
14, Oakwood Drive, Derby DE21 2LE
| Today | See what it's worth now |
| 27 Mar 2026 | £345,000 |
| 25 Apr 2006 | £187,950 |
6, Foxfields Drive, Derby DE21 2ND
| Today | See what it's worth now |
| 23 Mar 2026 | £320,000 |
| 4 Jul 2019 | £235,000 |
18, Grassthorpe Close, Derby DE21 4RW
| Today | See what it's worth now |
| 20 Mar 2026 | £225,000 |
| 11 Dec 2020 | £172,500 |
12, Swinderby Drive, Derby DE21 4RN
| Today | See what it's worth now |
| 16 Mar 2026 | £155,000 |
| 29 Aug 2019 | £115,000 |
65, Fiskerton Way, Derby DE21 2HY

| Today | See what it's worth now |
| 16 Mar 2026 | £200,000 |
| 5 Mar 2021 | £155,000 |
6, Hucklow Court, Derby DE21 2TG
| Today | See what it's worth now |
| 13 Mar 2026 | £180,000 |
| 1 Feb 2002 | £59,500 |
13, Kirkstead Close, Derby DE21 2HN
| Today | See what it's worth now |
| 13 Mar 2026 | £440,000 |
| 6 Oct 2023 | £400,000 |
No other historical records.
26, Lydstep Close, Derby DE21 2RY
| Today | See what it's worth now |
| 13 Mar 2026 | £155,000 |
| 3 Jul 2014 | £117,000 |
12, Rye Close, Derby DE21 2BU

| Today | See what it's worth now |
| 12 Mar 2026 | £312,000 |
| 18 Oct 2002 | £125,500 |
7, Gleadsmoss Lane, Derby DE21 2BP
| Today | See what it's worth now |
| 9 Mar 2026 | £297,000 |
| 10 May 2019 | £187,500 |
1, Beardmore Close, Derby DE21 2UN
| Today | See what it's worth now |
| 4 Mar 2026 | £195,000 |
| 16 Jun 2023 | £182,500 |
98, Smalley Drive, Derby DE21 2SQ

| Today | See what it's worth now |
| 2 Mar 2026 | £157,500 |
| 16 Mar 2001 | £54,000 |
1, Hedgebank Court, Derby DE21 2XS
| Today | See what it's worth now |
| 27 Feb 2026 | £181,500 |
| 10 Dec 2013 | £125,000 |
No other historical records.
18, Santolina Drive, Derby DE21 2DQ
| Today | See what it's worth now |
| 24 Feb 2026 | £225,000 |
| 11 Feb 2021 | £200,000 |
No other historical records.
2, Samantha Court, Derby DE21 2JQ
| Today | See what it's worth now |
| 23 Feb 2026 | £158,000 |
| 8 Aug 1997 | £37,500 |
No other historical records.
14, Cressbrook Way, Derby DE21 2RZ
| Today | See what it's worth now |
| 23 Feb 2026 | £303,000 |
| 13 Sep 2013 | £179,000 |
Source Acknowledgement: © Crown copyright. England and Wales house price data is publicly available information produced by the HM Land Registry.This material was last updated on 9 July 2026. It covers the period from 1 January 1995 to 30 April 2026 and contains property transactions which have been registered during that period. Contains HM Land Registry data © Crown copyright and database right 2026. This data is licensed under the Open Government Licence v3.0.
Disclaimer: Rightmove.co.uk provides this HM Land Registry data "as is". The burden for fitness of the data relies completely with the user and is provided for informational purposes only. No warranty, express or implied, is given relating to the accuracy of content of the HM Land Registry data and Rightmove does not accept any liability for error or omission. If you have found an error with the data or need further information please contact HM Land Registry.
Permitted Use: Viewers of this Information are granted permission to access this Crown copyright material and to download it onto electronic, magnetic, optical or similar storage media provided that such activities are for private research, study or in-house use only. Any other use of the material requires the formal written permission of Land Registry which can be requested from us, and is subject to an additional licence and associated charge.
Rightmove takes no liability for your use of, or reliance on, Rightmove's Instant Valuation due to the limitations of our tracking tool listed here. Use of this tool is taken entirely at your own risk. All rights reserved.