
House Prices in Orpington
House prices in Orpington have an overall average of £605,771 over the last year.
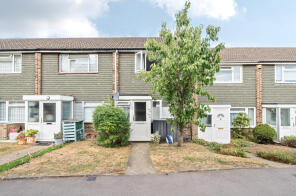
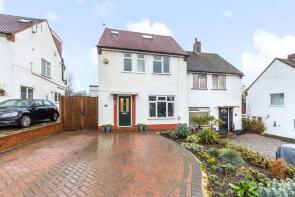
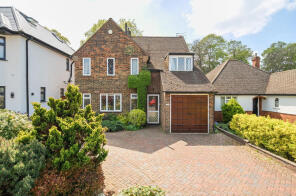
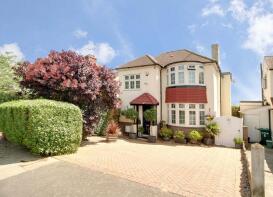
The majority of properties sold in Orpington during the last year were semi-detached properties, selling for an average price of £586,820. Detached properties sold for an average of £918,576, with terraced properties fetching £449,962.
Overall, the historical sold prices in Orpington over the last year were similar to the previous year and 2% down on the 2022 peak of £620,402.
Properties Sold
74, Clarendon Way, Chislehurst BR5 2PF
| Today | See what it's worth now |
| 27 Apr 2026 | £180,000 |
| 25 Oct 2024 | £180,000 |
No other historical records.
3, Faringdon Avenue, Bromley BR2 8BP
| Today | See what it's worth now |
| 24 Apr 2026 | £500,000 |
| 1 Nov 2002 | £239,950 |
1, Wesley Close, Orpington BR5 3HH
| Today | See what it's worth now |
| 24 Apr 2026 | £370,000 |
| 7 Dec 2006 | £181,000 |
No other historical records.
44, Rolleston Avenue, Petts Wood, Orpington BR5 1AL
| Today | See what it's worth now |
| 24 Apr 2026 | £725,000 |
| 25 Sep 1995 | £107,500 |
No other historical records.
54, Cathcart Drive, Orpington BR6 8BX
| Today | See what it's worth now |
| 20 Apr 2026 | £867,500 |
| 12 Oct 2017 | £540,000 |
91, Gillmans Road, Orpington BR5 4LD
| Today | See what it's worth now |
| 20 Apr 2026 | £512,000 |
| 22 Nov 2019 | £471,000 |
No other historical records.
76, Felstead Road, Orpington BR6 9AE

| Today | See what it's worth now |
| 17 Apr 2026 | £685,000 |
| 9 Jan 2003 | £365,000 |
4, Lovibonds Avenue, Orpington BR6 8ER
| Today | See what it's worth now |
| 16 Apr 2026 | £510,000 |
No other historical records.
38, Gladstone Road, Orpington BR6 7DZ
| Today | See what it's worth now |
| 15 Apr 2026 | £610,000 |
| 18 Jul 2003 | £211,000 |
No other historical records.
18, Cockmannings Road, Orpington BR5 4HY
| Today | See what it's worth now |
| 14 Apr 2026 | £410,000 |
| 10 Feb 2023 | £435,000 |
38, Rookesley Road, Orpington BR5 4HJ
| Today | See what it's worth now |
| 13 Apr 2026 | £560,000 |
| 16 Jan 2004 | £180,000 |
No other historical records.
9, Nicolson Road, Orpington BR5 4EH
| Today | See what it's worth now |
| 13 Apr 2026 | £480,000 |
| 9 May 2018 | £410,000 |
23, Paddock Close, Orpington BR6 7TL
| Today | See what it's worth now |
| 10 Apr 2026 | £820,000 |
| 17 Mar 2010 | £435,000 |
58, Sparrow Drive, Orpington BR5 1RZ
| Today | See what it's worth now |
| 10 Apr 2026 | £540,000 |
| 14 Oct 2011 | £267,500 |
199, Crofton Lane, Orpington BR6 0BP
| Today | See what it's worth now |
| 10 Apr 2026 | £790,000 |
| 15 Feb 2013 | £450,000 |
52, Rolleston Avenue, Petts Wood, Orpington BR5 1AL
| Today | See what it's worth now |
| 10 Apr 2026 | £525,000 |
| 22 Mar 1996 | £100,000 |
No other historical records.
13, Oakdene Road, Orpington BR5 2AJ
| Today | See what it's worth now |
| 9 Apr 2026 | £425,000 |
| 6 Jun 2022 | £442,000 |
No other historical records.
26a, Derry Downs, Orpington BR5 4DT

| Today | See what it's worth now |
| 9 Apr 2026 | £365,000 |
| 30 Jun 2022 | £330,000 |
87, Rolleston Avenue, Petts Wood, Orpington BR5 1AL
| Today | See what it's worth now |
| 9 Apr 2026 | £630,000 |
| 14 Jul 2010 | £298,000 |
No other historical records.
119, Clareville Road, Orpington BR5 1RU
| Today | See what it's worth now |
| 9 Apr 2026 | £430,000 |
| 25 Sep 2019 | £357,000 |
40, Sandhurst Road, Orpington BR6 9HW
| Today | See what it's worth now |
| 8 Apr 2026 | £680,000 |
| 30 Oct 2020 | £395,000 |
No other historical records.
116, Park Avenue, Orpington BR6 9EE
| Today | See what it's worth now |
| 8 Apr 2026 | £750,000 |
| 28 Jul 2020 | £705,000 |
No other historical records.
344, Main Road, Westerham TN16 2HN

| Today | See what it's worth now |
| 8 Apr 2026 | £950,000 |
| 18 Jul 2019 | £830,000 |
No other historical records.
Source Acknowledgement: © Crown copyright. England and Wales house price data is publicly available information produced by the HM Land Registry.This material was last updated on 9 July 2026. It covers the period from 1 January 1995 to 30 April 2026 and contains property transactions which have been registered during that period. Contains HM Land Registry data © Crown copyright and database right 2026. This data is licensed under the Open Government Licence v3.0.
Disclaimer: Rightmove.co.uk provides this HM Land Registry data "as is". The burden for fitness of the data relies completely with the user and is provided for informational purposes only. No warranty, express or implied, is given relating to the accuracy of content of the HM Land Registry data and Rightmove does not accept any liability for error or omission. If you have found an error with the data or need further information please contact HM Land Registry.
Permitted Use: Viewers of this Information are granted permission to access this Crown copyright material and to download it onto electronic, magnetic, optical or similar storage media provided that such activities are for private research, study or in-house use only. Any other use of the material requires the formal written permission of Land Registry which can be requested from us, and is subject to an additional licence and associated charge.
Rightmove takes no liability for your use of, or reliance on, Rightmove's Instant Valuation due to the limitations of our tracking tool listed here. Use of this tool is taken entirely at your own risk. All rights reserved.