
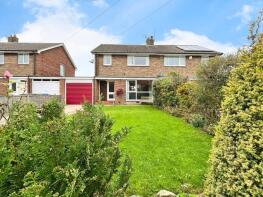
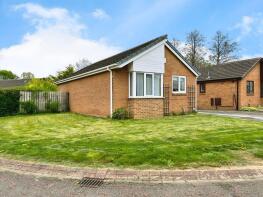
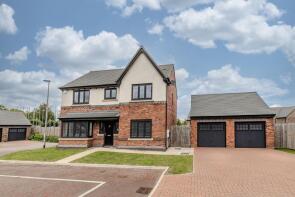
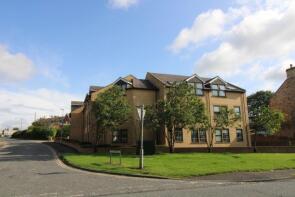
House Prices in Ponteland
House prices in Ponteland have an overall average of £547,938 over the last year.
The majority of properties sold in Ponteland during the last year were detached properties, selling for an average price of £760,144. Flats sold for an average of £186,379, with semi-detached properties fetching £348,616.
Overall, the historical sold prices in Ponteland over the last year were similar to the previous year and 1% up on the 2022 peak of £541,417.
Properties Sold
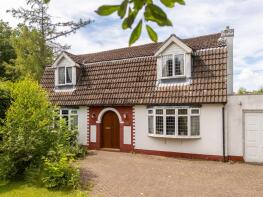
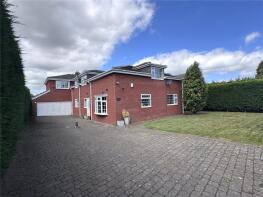
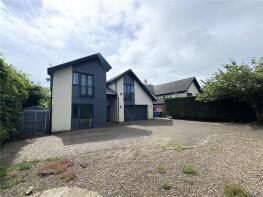
48, Western Way, Darras Hall, Newcastle Upon Tyne NE20 9AP
| Today | See what it's worth now |
| 24 Apr 2026 | £495,000 |
| 5 Feb 1997 | £159,000 |
No other historical records.
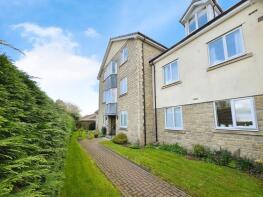
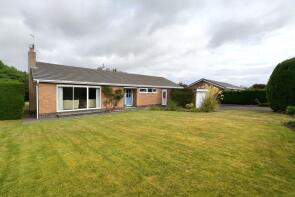
31, Cecil Court, Newcastle Upon Tyne NE20 9EE
| Today | See what it's worth now |
| 23 Apr 2026 | £182,500 |
| 26 Sep 2018 | £186,000 |
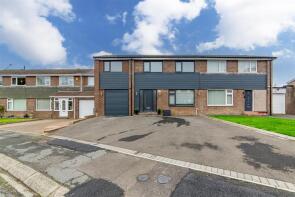
59, Cheviot View, Newcastle Upon Tyne NE20 9BH
| Today | See what it's worth now |
| 23 Apr 2026 | £575,000 |
| 19 Oct 2020 | £402,500 |
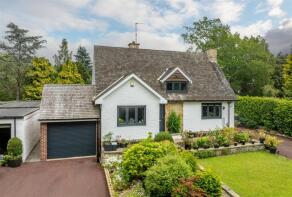
16, Dunsgreen, Newcastle Upon Tyne NE20 9EH
| Today | See what it's worth now |
| 1 Apr 2026 | £375,000 |
| 20 Oct 1999 | £120,000 |
No other historical records.
57, Dunsgreen, Newcastle Upon Tyne NE20 9EJ
| Today | See what it's worth now |
| 1 Apr 2026 | £415,000 |
| 14 Aug 2017 | £285,000 |
No other historical records.
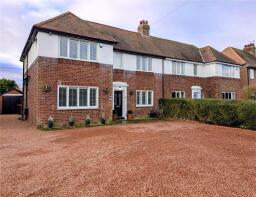
9, Ridgely Close, Newcastle Upon Tyne NE20 9BN
| Today | See what it's worth now |
| 31 Mar 2026 | £608,000 |
| 17 May 2018 | £445,000 |
8, Lewis Close, Jameson Manor, Newcastle Upon Tyne NE20 0FA
| Today | See what it's worth now |
| 23 Mar 2026 | £168,000 |
| 26 Nov 2020 | £124,495 |
No other historical records.
18, Elmwood Drive, Newcastle Upon Tyne NE20 9QQ
| Today | See what it's worth now |
| 20 Mar 2026 | £318,000 |
| 25 Oct 2019 | £182,000 |
No other historical records.
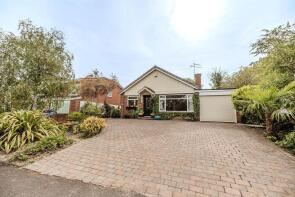
46, Henderson Court, North Road, Ponteland NE20 9GY
| Today | See what it's worth now |
| 16 Mar 2026 | £125,000 |
| 29 Jul 2016 | £222,499 |
No other historical records.
95, Thornhill Road, Ponteland NE20 9QE
| Today | See what it's worth now |
| 6 Mar 2026 | £280,000 |
No other historical records.
26, Eland Edge, Newcastle Upon Tyne NE20 9AY
| Today | See what it's worth now |
| 5 Mar 2026 | £360,000 |
| 10 Jul 2017 | £280,000 |
2, Knoll Place, Woodlands Manor, Newcastle Upon Tyne NE20 0EL
| Today | See what it's worth now |
| 27 Feb 2026 | £570,000 |
| 24 Jun 2021 | £461,245 |
No other historical records.
4, Meadowfield Park, Newcastle Upon Tyne NE20 9XF
| Today | See what it's worth now |
| 20 Feb 2026 | £71,000 |
| 21 Dec 2022 | £76,000 |
39, Ladywell Way, Newcastle Upon Tyne NE20 9TE
| Today | See what it's worth now |
| 20 Feb 2026 | £300,000 |
| 24 May 2019 | £267,500 |
62, Parklands, Darras Hall, Newcastle Upon Tyne NE20 9LN
| Today | See what it's worth now |
| 13 Feb 2026 | £775,000 |
| 4 Mar 2003 | £379,950 |
No other historical records.
6, Henderson Court, North Road, Ponteland NE20 9GY

| Today | See what it's worth now |
| 13 Feb 2026 | £180,000 |
| 11 Aug 2023 | £190,000 |
227, Darras Road, Darras Hall, Newcastle Upon Tyne NE20 9AJ
| Today | See what it's worth now |
| 9 Feb 2026 | £1,550,000 |
| 18 Feb 2022 | £1,300,000 |
54, Parklands, Darras Hall, Ponteland NE20 9LL
| Today | See what it's worth now |
| 6 Feb 2026 | £450,000 |
No other historical records.
186, Darras Road, Darras Hall, Newcastle Upon Tyne NE20 9AF
| Today | See what it's worth now |
| 4 Feb 2026 | £1,325,000 |
| 22 Aug 2023 | £530,000 |
29, Henderson Court, North Road, Ponteland NE20 9GY

| Today | See what it's worth now |
| 4 Feb 2026 | £300,000 |
| 14 Jan 2016 | £305,000 |
No other historical records.
17, Birney Edge, Darras Hall, Newcastle Upon Tyne NE20 9JJ
| Today | See what it's worth now |
| 4 Feb 2026 | £865,000 |
| 8 Aug 2012 | £720,000 |
16, Larchlea South, Darras Hall, Ponteland NE20 9LW
| Today | See what it's worth now |
| 30 Jan 2026 | £521,000 |
No other historical records.
16, Rowan Drive, Newcastle Upon Tyne NE20 9QL
| Today | See what it's worth now |
| 28 Jan 2026 | £385,000 |
| 6 Jul 2022 | £225,000 |
No other historical records.
Source Acknowledgement: © Crown copyright. England and Wales house price data is publicly available information produced by the HM Land Registry.This material was last updated on 9 July 2026. It covers the period from 1 January 1995 to 30 April 2026 and contains property transactions which have been registered during that period. Contains HM Land Registry data © Crown copyright and database right 2026. This data is licensed under the Open Government Licence v3.0.
Disclaimer: Rightmove.co.uk provides this HM Land Registry data "as is". The burden for fitness of the data relies completely with the user and is provided for informational purposes only. No warranty, express or implied, is given relating to the accuracy of content of the HM Land Registry data and Rightmove does not accept any liability for error or omission. If you have found an error with the data or need further information please contact HM Land Registry.
Permitted Use: Viewers of this Information are granted permission to access this Crown copyright material and to download it onto electronic, magnetic, optical or similar storage media provided that such activities are for private research, study or in-house use only. Any other use of the material requires the formal written permission of Land Registry which can be requested from us, and is subject to an additional licence and associated charge.
Rightmove takes no liability for your use of, or reliance on, Rightmove's Instant Valuation due to the limitations of our tracking tool listed here. Use of this tool is taken entirely at your own risk. All rights reserved.