
House Prices in Priory Grange
House prices in Priory Grange have an overall average of £141,980 over the last year.
The majority of properties sold in Priory Grange during the last year were terraced properties, selling for an average price of £134,308. Semi-detached properties sold for an average of £155,017, with detached properties fetching £248,500.
Overall, the historical sold prices in Priory Grange over the last year were 2% up on the previous year and 3% up on the 2023 peak of £138,037.
Properties Sold
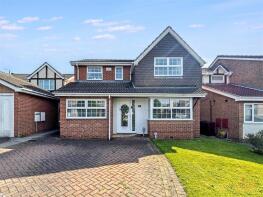
2, Sorrel Drive, Hull HU5 5GD
| Today | See today's value |
| 28 Aug 2026 | £278,000 |
| 27 Nov 2015 | £185,000 |
565, Hotham Road South, Hull HU5 5UE
| Today | See today's value |
| 17 Aug 2026 | £105,000 |
| 5 Jul 2021 | £90,000 |
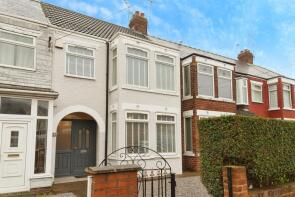
164, Priory Road, Hull HU5 5RX
| Today | See today's value |
| 17 Aug 2026 | £157,000 |
| 7 Sep 2018 | £110,000 |
No other historical records.
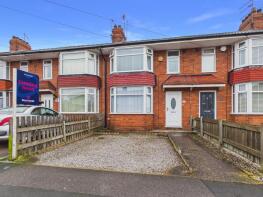
105, Westlands Road, Hull HU5 5NX
| Today | See today's value |
| 14 Aug 2026 | £152,000 |
| 20 Oct 2017 | £110,000 |
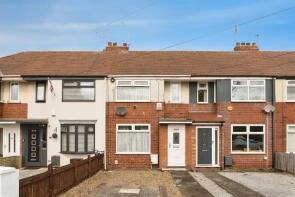
658, Hotham Road South, Hull HU5 5LE
| Today | See today's value |
| 10 Aug 2026 | £115,000 |
| 29 Nov 2024 | £103,000 |
50, Kirklands Road, Hull HU5 5AU
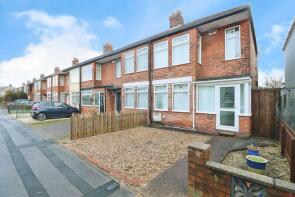
| Today | See today's value |
| 7 Aug 2026 | £140,000 |
| 23 Dec 1996 | £40,000 |
No other historical records.
16, Cedarwood Drive, Hull HU5 5YA
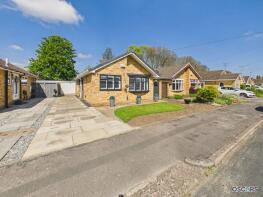
| Today | See today's value |
| 7 Aug 2026 | £270,000 |
| 1 Dec 2023 | £240,000 |
86, Brooklands Road, Hull HU5 5AE
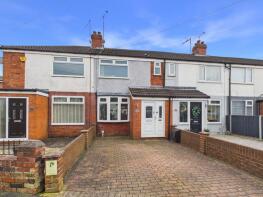
| Today | See today's value |
| 7 Aug 2026 | £145,000 |
| 25 Sep 2020 | £111,000 |
No other historical records.
26, Nelson Road, Hull HU5 5HL
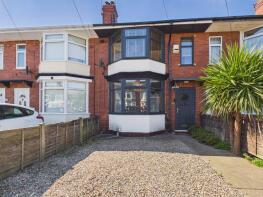
| Today | See today's value |
| 3 Aug 2026 | £146,000 |
| 8 Apr 2021 | £115,000 |
12, Sorbus View, Hull HU5 5YZ
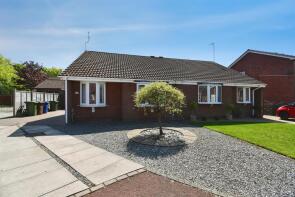
| Today | See today's value |
| 3 Aug 2026 | £215,000 |
| 30 Nov 2012 | £135,000 |
50, Patterdale Road, Hull HU5 5AR
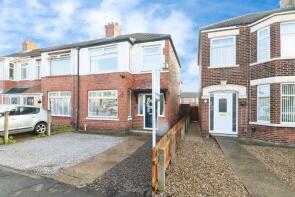
| Today | See today's value |
| 3 Aug 2026 | £167,500 |
| 23 Jun 2021 | £145,650 |
24, Worcester Road, Hull HU5 5XE
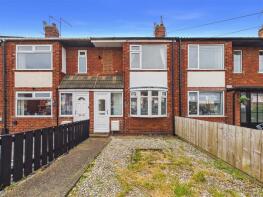
| Today | See today's value |
| 31 Jul 2026 | £117,000 |
| 22 May 2003 | £56,950 |
No other historical records.
128, Bristol Road, Hull HU5 5XN
| Today | See today's value |
| 31 Jul 2026 | £150,000 |
| 21 Mar 2003 | £46,000 |
17, Cedarwood Drive, Anlaby Common HU5 5YA
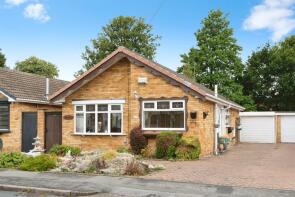
| Today | See today's value |
| 31 Jul 2026 | £205,000 |
No other historical records.
98, Brooklands Road, Hull HU5 5AE
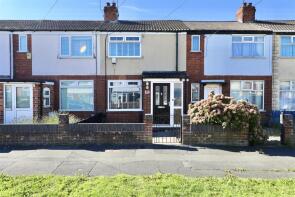
| Today | See today's value |
| 30 Jul 2026 | £125,000 |
| 29 Jul 2019 | £98,000 |
35, Nunburnholme Park, Hull HU5 5YN
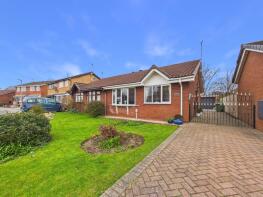
| Today | See today's value |
| 27 Jul 2026 | £225,000 |
| 28 Apr 2021 | £128,000 |
16, Dayton Road, Kingston Upon Hull HU5 5TG
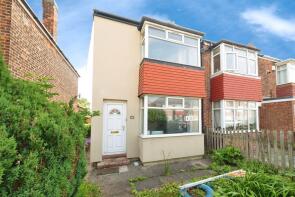
| Today | See today's value |
| 20 Jul 2026 | £97,000 |
No other historical records.
19, Westlands Road, Hull HU5 5NE

| Today | See today's value |
| 14 Jul 2026 | £165,000 |
| 10 Jun 2005 | £98,000 |
303, Willerby Road, Hull HU5 5HP
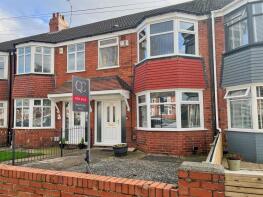
| Today | See today's value |
| 13 Jul 2026 | £178,000 |
| 14 Jul 2006 | £129,950 |
96, Worcester Road, Hull HU5 5UZ
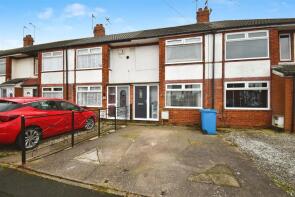
| Today | See today's value |
| 10 Jul 2026 | £140,000 |
| 21 Sep 2018 | £110,000 |
10, Malvern Road, Hull HU5 5TZ
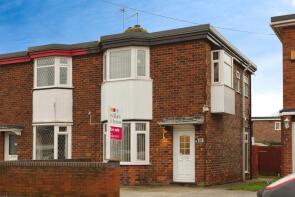
| Today | See today's value |
| 10 Jul 2026 | £135,000 |
| 4 Nov 2005 | £87,500 |
21, Willerby Carr Close, Kingston Upon Hull HU5 5PG
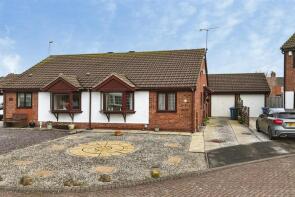
| Today | See today's value |
| 10 Jul 2026 | £148,000 |
No other historical records.
107, Wold Road, Hull HU5 5NL
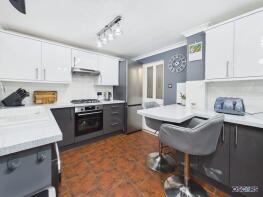
| Today | See today's value |
| 10 Jul 2026 | £154,950 |
| 7 Nov 2022 | £145,000 |
Rightmove takes no liability for your use of, or reliance on, Rightmove's Instant Valuation due to the limitations of our tracking tool listed here. Use of this tool is taken entirely at your own risk. All rights reserved.