
House Prices in Queensway
House prices in Queensway have an overall average of £145,136 over the last year.
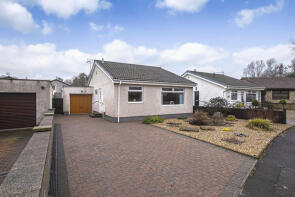
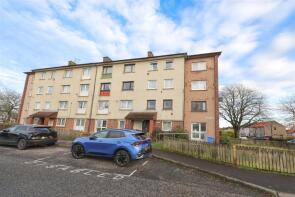
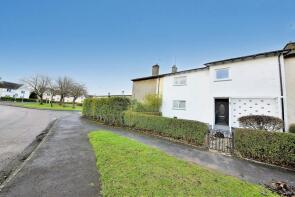
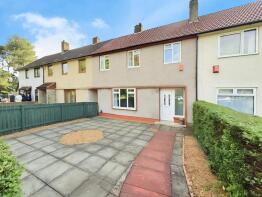
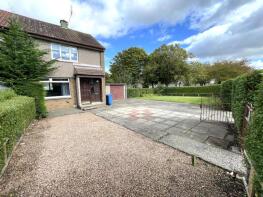
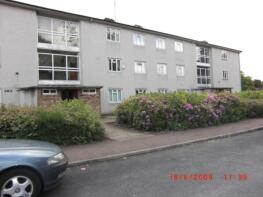
The majority of properties sold in Queensway during the last year were terraced properties, selling for an average price of £128,397. Semi-detached properties sold for an average of £172,076, with flats fetching £80,688.
Overall, the historical sold prices in Queensway over the last year were similar to the previous year and 9% up on the 2020 peak of £133,736.
Properties Sold
11, Carseggie Crescent, Glenrothes KY7 5DJ
| Today | See what it's worth now |
| 27 Apr 2026 | £210,520 |
| 22 Dec 2004 | £80,000 |
No other historical records.
6, Westwood Road, Glenrothes KY7 5BB
| Today | See what it's worth now |
| 27 Apr 2026 | £135,000 |
No other historical records.
14, Laurel Gardens, Glenrothes KY7 5HG
| Today | See what it's worth now |
| 21 Apr 2026 | £75,000 |
| 11 Nov 2020 | £62,500 |
27, Tiel Path, Glenrothes KY7 5AX

| Today | See what it's worth now |
| 16 Apr 2026 | £131,500 |
| 22 May 2020 | £85,000 |
11, Woodside Way, Glenrothes KY7 5DF
| Today | See what it's worth now |
| 15 Apr 2026 | £80,000 |
| 31 Aug 2018 | £58,000 |
10, Dura Crescent, Glenrothes KY7 5DA
| Today | See what it's worth now |
| 13 Apr 2026 | £123,000 |
No other historical records.
40a, Cedar Drive, Glenrothes KY7 5TL
| Today | See what it's worth now |
| 10 Apr 2026 | £167,500 |
No other historical records.
17, Dura Park, Glenrothes KY7 5EF
| Today | See what it's worth now |
| 1 Apr 2026 | £92,000 |
No other historical records.
8, Cornel Lane, Glenrothes KY7 5TB
| Today | See what it's worth now |
| 16 Mar 2026 | £215,000 |
| 2 Jul 2019 | £165,000 |
23, Church Street, Glenrothes KY7 5NF
| Today | See what it's worth now |
| 11 Mar 2026 | £65,500 |
| 7 Sep 2023 | £52,000 |
8, Lomond View, Glenrothes KY7 5EL
| Today | See what it's worth now |
| 6 Mar 2026 | £125,000 |
| 1 Oct 2025 | £65,000 |
No other historical records.
6, Russell Drive, Glenrothes KY7 5JN
| Today | See what it's worth now |
| 2 Mar 2026 | £110,000 |
| 29 Oct 2018 | £80,500 |
17, Balbirnie Road, Glenrothes KY7 5ED
| Today | See what it's worth now |
| 23 Feb 2026 | £160,100 |
No other historical records.
24, Cedar Drive, Glenrothes KY7 5TL
| Today | See what it's worth now |
| 23 Feb 2026 | £295,000 |
No other historical records.
23, Elm Lane, Glenrothes KY7 5TD
| Today | See what it's worth now |
| 16 Feb 2026 | £176,000 |
| 15 Sep 2009 | £20,000 |
21, Westwood Road, Glenrothes KY7 5BQ
| Today | See what it's worth now |
| 13 Feb 2026 | £142,210 |
| 2 Sep 2009 | £74,000 |
No other historical records.
28, Well Road, Glenrothes KY7 5HL
| Today | See what it's worth now |
| 26 Jan 2026 | £95,000 |
| 29 Oct 2015 | £56,000 |
No other historical records.
36, Carleton Avenue, Glenrothes KY7 5AJ
| Today | See what it's worth now |
| 19 Dec 2025 | £209,500 |
| 18 Dec 2020 | £150,000 |
5, Dura Crescent, Glenrothes KY7 5DA
| Today | See what it's worth now |
| 12 Dec 2025 | £131,000 |
| 23 Apr 2014 | £71,000 |
No other historical records.
32, Laverock Avenue, Glenrothes KY7 5HX
| Today | See what it's worth now |
| 9 Dec 2025 | £150,000 |
| 30 Sep 2013 | £84,000 |
No other historical records.
9, Church Street, Glenrothes KY7 5NF

| Today | See what it's worth now |
| 3 Dec 2025 | £75,000 |
| 8 Nov 2018 | £50,000 |
4, Leven Place, Glenrothes KY7 5AZ
| Today | See what it's worth now |
| 1 Dec 2025 | £155,000 |
| 28 Jul 2014 | £75,153 |
8, Birchtree Road, Glenrothes KY7 5DX
| Today | See what it's worth now |
| 24 Nov 2025 | £138,141 |
| 28 Sep 2006 | £91,000 |

Source Acknowledgement: © Crown copyright. Scottish house price data is publicly available information produced by the Registers of Scotland. Material has been reproduced with the permission of the Keeper of the Registers of Scotland and contains data compiled by Registers of Scotland. For further information, please contact data@ros.gov.uk. Please note the dates shown here relate to the property's registered date not sold date.This material was last updated on 10 July 2026. It covers the period from 8 December 1987 to 30 April 2026 and contains property transactions which have been registered during that period.
Disclaimer: Rightmove.co.uk provides this Registers of Scotland data "as is". The burden for fitness of the data relies completely with the user and is provided for informational purposes only. No warranty, express or implied, is given relating to the accuracy of content of the Registers of Scotland data and Rightmove plc does not accept any liability for error or omission. If you have found an error with the data or need further information please contact data@ros.gov.uk
Permitted Use: The Registers of Scotland allows the reproduction of the data which it provides to Rightmove.co.uk free of charge in any format or medium only for research, private study or for internal circulation within an organisation. This is subject to it being reproduced accurately and not used in a misleading context. The material must be acknowledged as Crown Copyright. You are not allowed to use this information for commercial purposes, nor must you copy, distribute, sell or publish the data in any way. For any other use of this material, please apply to the Registers of Scotland for a licence. You can do this online at www.ros.gov.uk, by email at data@ros.gov.uk or by writing to Business Development, Registers of Scotland, Meadowbank House, 153 London Road, Edinburgh EH8 7AU.
Rightmove takes no liability for your use of, or reliance on, Rightmove's Instant Valuation due to the limitations of our tracking tool listed here. Use of this tool is taken entirely at your own risk. All rights reserved.