
House Prices in RM5
House prices in RM5 have an overall average of £420,501 over the last year.
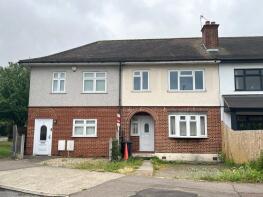
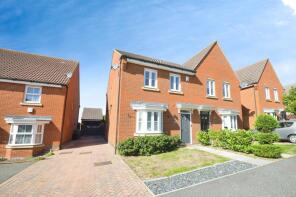
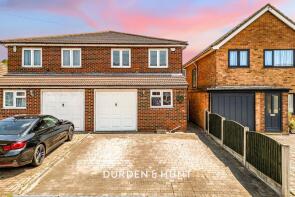
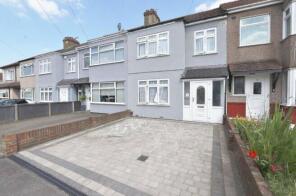
The majority of properties sold in RM5 during the last year were semi-detached properties, selling for an average price of £465,279. Terraced properties sold for an average of £407,534, with flats fetching £251,941.
Overall, the historical sold prices in RM5 over the last year were 4% down on the previous year and 2% down on the 2022 peak of £428,072.
Properties Sold
76, Hillrise Road, Romford RM5 3BQ

| Today | See what it's worth now |
| 17 Apr 2026 | £395,000 |
| 21 Nov 2007 | £177,500 |
276a, Lodge Lane, Romford RM5 2EX
| Today | See what it's worth now |
| 2 Apr 2026 | £510,000 |
| 9 Sep 2016 | £376,000 |
No other historical records.
11a, Clitheroe Road, Romford RM5 2ST
| Today | See what it's worth now |
| 2 Apr 2026 | £465,000 |
| 28 Apr 2006 | £187,000 |
Extensions and planning permission in RM5
See planning approval stats, extension build costs and value added estimates.

3, Mowbrays Road, Romford RM5 3ET
| Today | See what it's worth now |
| 27 Mar 2026 | £513,000 |
| 7 Sep 2017 | £393,000 |
7, Bamford Way, Romford RM5 2HS
| Today | See what it's worth now |
| 27 Mar 2026 | £405,000 |
| 23 Apr 2001 | £97,000 |
No other historical records.
18, Ashvale Gardens, Romford RM5 3QA
| Today | See what it's worth now |
| 27 Mar 2026 | £392,000 |
| 29 Nov 1996 | £59,995 |
No other historical records.
22, Dunster Close, Romford RM5 3AT

| Today | See what it's worth now |
| 26 Mar 2026 | £550,000 |
| 8 Jan 2016 | £306,000 |
No other historical records.
4, Ramsden Drive, Romford RM5 2NJ
| Today | See what it's worth now |
| 25 Mar 2026 | £370,000 |
| 29 Feb 2008 | £205,000 |
No other historical records.
38, Firbank Road, Romford RM5 2TR
| Today | See what it's worth now |
| 20 Mar 2026 | £450,000 |
| 10 Dec 2013 | £205,000 |
19, Irons Way, Romford RM5 3RJ
| Today | See what it's worth now |
| 20 Mar 2026 | £415,000 |
| 6 Oct 2006 | £195,000 |
12, 106 Fern Court, Lodge Lane, Romford RM5 2ET
| Today | See what it's worth now |
| 17 Mar 2026 | £210,000 |
| 7 Dec 2018 | £225,000 |
52, Gelsthorpe Road, Romford RM5 2NA
| Today | See what it's worth now |
| 13 Mar 2026 | £521,000 |
| 8 Sep 2006 | £112,316 |
No other historical records.
20, Ramsden Drive, Romford RM5 2NL
| Today | See what it's worth now |
| 12 Mar 2026 | £442,500 |
| 20 Jan 2017 | £348,000 |
47, Carter Drive, Romford RM5 2PH
| Today | See what it's worth now |
| 11 Mar 2026 | £355,000 |
No other historical records.
1a, Lowshoe Lane, Romford RM5 2AA
| Today | See what it's worth now |
| 9 Mar 2026 | £385,000 |
| 4 Jan 2016 | £285,000 |
No other historical records.
14, Litten Close, Collier Row, Romford RM5 2LG
| Today | See what it's worth now |
| 6 Mar 2026 | £510,000 |
| 27 Jun 2008 | £299,995 |
No other historical records.
54, Boxmoor Road, Romford RM5 2SJ
| Today | See what it's worth now |
| 6 Mar 2026 | £450,000 |
| 23 Mar 2012 | £186,000 |
No other historical records.
12, Mount Pleasant Road, Romford RM5 3YL
| Today | See what it's worth now |
| 5 Mar 2026 | £525,000 |
| 20 Jan 2020 | £430,000 |
58, Gelsthorpe Road, Romford RM5 2NA
| Today | See what it's worth now |
| 4 Mar 2026 | £410,000 |
| 20 Aug 2012 | £195,000 |
No other historical records.
117, Carter Drive, Romford RM5 2UU
| Today | See what it's worth now |
| 27 Feb 2026 | £450,000 |
| 28 Mar 2024 | £350,000 |
No other historical records.
8, Craven Gardens, Collier Row, Romford RM5 2JA
| Today | See what it's worth now |
| 27 Feb 2026 | £470,000 |
| 14 Aug 2015 | £318,000 |
No other historical records.
31, Chelmsford Avenue, Romford RM5 3UX
| Today | See what it's worth now |
| 26 Feb 2026 | £275,000 |
No other historical records.
70, Highfield Road, Romford RM5 3SA
| Today | See what it's worth now |
| 25 Feb 2026 | £495,000 |
No other historical records.
Source Acknowledgement: © Crown copyright. England and Wales house price data is publicly available information produced by the HM Land Registry.This material was last updated on 9 July 2026. It covers the period from 1 January 1995 to 30 April 2026 and contains property transactions which have been registered during that period. Contains HM Land Registry data © Crown copyright and database right 2026. This data is licensed under the Open Government Licence v3.0.
Disclaimer: Rightmove.co.uk provides this HM Land Registry data "as is". The burden for fitness of the data relies completely with the user and is provided for informational purposes only. No warranty, express or implied, is given relating to the accuracy of content of the HM Land Registry data and Rightmove does not accept any liability for error or omission. If you have found an error with the data or need further information please contact HM Land Registry.
Permitted Use: Viewers of this Information are granted permission to access this Crown copyright material and to download it onto electronic, magnetic, optical or similar storage media provided that such activities are for private research, study or in-house use only. Any other use of the material requires the formal written permission of Land Registry which can be requested from us, and is subject to an additional licence and associated charge.
Rightmove takes no liability for your use of, or reliance on, Rightmove's Instant Valuation due to the limitations of our tracking tool listed here. Use of this tool is taken entirely at your own risk. All rights reserved.