
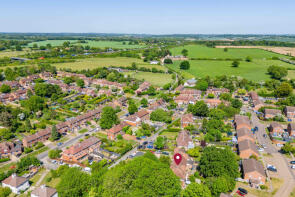
House Prices in Redbourn
House prices in Redbourn have an overall average of £660,132 over the last year.
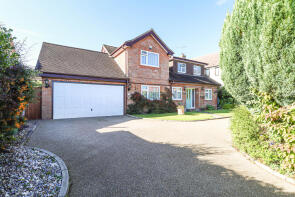
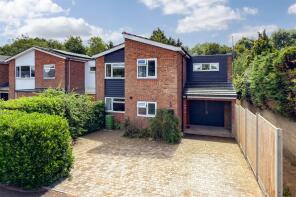
The majority of properties sold in Redbourn during the last year were semi-detached properties, selling for an average price of £638,919. Terraced properties sold for an average of £544,462, with detached properties fetching £943,542.
Overall, the historical sold prices in Redbourn over the last year were 3% up on the previous year and 8% down on the 2022 peak of £717,740.
Properties Sold
74, Lybury Lane, St. Albans AL3 7JF
| Today | See what it's worth now |
| 9 Apr 2026 | £495,000 |
| 8 Dec 2020 | £438,000 |
14, Wheatlock Mead, Redbourn AL3 7HS
| Today | See what it's worth now |
| 9 Apr 2026 | £650,000 |
No other historical records.
12 13, North Common, St. Albans AL3 7DA
| Today | See what it's worth now |
| 2 Apr 2026 | £815,000 |
| 22 Aug 2005 | £445,000 |
7, Flamsteadbury Lane, St. Albans AL3 7DH

| Today | See what it's worth now |
| 31 Mar 2026 | £630,000 |
| 15 Mar 2012 | £321,000 |
No other historical records.
40, Tassell Hall, St. Albans AL3 7JE
| Today | See what it's worth now |
| 31 Mar 2026 | £560,000 |
| 13 Apr 2004 | £187,500 |
No other historical records.
20, Lybury Lane, St. Albans AL3 7HY
| Today | See what it's worth now |
| 30 Mar 2026 | £975,000 |
| 14 Sep 2007 | £575,000 |
77, Lybury Lane, St. Albans AL3 7JA
| Today | See what it's worth now |
| 27 Mar 2026 | £605,000 |
| 6 Nov 2023 | £587,500 |
7, Lynsey Close, St. Albans AL3 7PW
| Today | See what it's worth now |
| 27 Mar 2026 | £755,000 |
| 9 Feb 2001 | £250,000 |
No other historical records.
19, Cavan Road, St. Albans AL3 7BN
| Today | See what it's worth now |
| 20 Mar 2026 | £950,000 |
| 9 Sep 2016 | £605,000 |
8, Church End, St. Albans AL3 7DU
| Today | See what it's worth now |
| 12 Mar 2026 | £1,200,000 |
| 19 Oct 2001 | £385,000 |
No other historical records.
79, Lybury Lane, St. Albans AL3 7JA

| Today | See what it's worth now |
| 9 Mar 2026 | £628,000 |
| 1 Sep 2022 | £615,000 |
25, Mansdale Road, Redbourn AL3 7DL
| Today | See what it's worth now |
| 9 Mar 2026 | £530,000 |
No other historical records.
3, West Common, St. Albans AL3 7DY
| Today | See what it's worth now |
| 9 Mar 2026 | £350,000 |
| 14 Jun 2019 | £290,000 |
No other historical records.
82, Lybury Lane, St. Albans AL3 7JF
| Today | See what it's worth now |
| 20 Feb 2026 | £475,900 |
| 3 Mar 2022 | £437,500 |
21, New Forge Place, St. Albans AL3 7NY
| Today | See what it's worth now |
| 13 Feb 2026 | £195,000 |
| 19 Jan 2023 | £218,000 |
48, Down Edge, St. Albans AL3 7JP
| Today | See what it's worth now |
| 23 Jan 2026 | £420,000 |
| 3 Jul 2000 | £117,500 |
9, Linden Road, St. Albans AL3 7PL
| Today | See what it's worth now |
| 23 Jan 2026 | £930,000 |
| 18 Oct 2018 | £587,000 |
72, Harpenden Lane, St. Albans AL3 7PB
| Today | See what it's worth now |
| 23 Jan 2026 | £620,000 |
| 7 Jun 2019 | £535,000 |
9, Hemel Hempstead Road, Redbourn AL3 7NL
| Today | See what it's worth now |
| 20 Jan 2026 | £690,000 |
No other historical records.
57, Hilltop, Redbourn AL3 7JG
| Today | See what it's worth now |
| 15 Jan 2026 | £342,500 |
No other historical records.
13, Rickyard Meadow, St. Albans AL3 7HT
| Today | See what it's worth now |
| 17 Dec 2025 | £950,000 |
| 4 Nov 1999 | £335,000 |
No other historical records.
96, The Park, St. Albans AL3 7LT
| Today | See what it's worth now |
| 5 Dec 2025 | £755,000 |
| 28 May 2015 | £441,500 |
No other historical records.
Annexe, Sheppards Corner, Gaddesden Lane, Redbourn AL3 7AS
| Today | See what it's worth now |
| 5 Dec 2025 | £1,092,500 |
No other historical records.
Source Acknowledgement: © Crown copyright. England and Wales house price data is publicly available information produced by the HM Land Registry.This material was last updated on 9 July 2026. It covers the period from 1 January 1995 to 30 April 2026 and contains property transactions which have been registered during that period. Contains HM Land Registry data © Crown copyright and database right 2026. This data is licensed under the Open Government Licence v3.0.
Disclaimer: Rightmove.co.uk provides this HM Land Registry data "as is". The burden for fitness of the data relies completely with the user and is provided for informational purposes only. No warranty, express or implied, is given relating to the accuracy of content of the HM Land Registry data and Rightmove does not accept any liability for error or omission. If you have found an error with the data or need further information please contact HM Land Registry.
Permitted Use: Viewers of this Information are granted permission to access this Crown copyright material and to download it onto electronic, magnetic, optical or similar storage media provided that such activities are for private research, study or in-house use only. Any other use of the material requires the formal written permission of Land Registry which can be requested from us, and is subject to an additional licence and associated charge.
Rightmove takes no liability for your use of, or reliance on, Rightmove's Instant Valuation due to the limitations of our tracking tool listed here. Use of this tool is taken entirely at your own risk. All rights reserved.