
House Prices in Rendlesham
House prices in Rendlesham have an overall average of £312,782 over the last year.
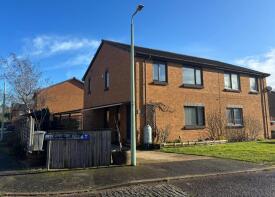
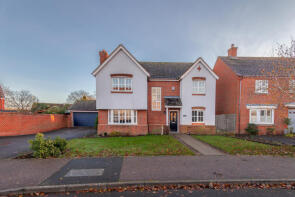
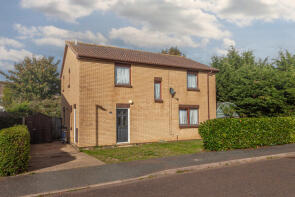
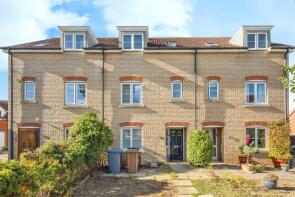
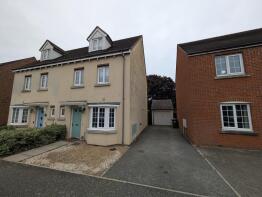
The majority of properties sold in Rendlesham during the last year were detached properties, selling for an average price of £433,462. Semi-detached properties sold for an average of £295,833, with terraced properties fetching £238,045.
Overall, the historical sold prices in Rendlesham over the last year were 10% up on the previous year and 4% up on the 2021 peak of £301,225.
Properties Sold
27, Hercules Road, Woodbridge IP12 2GP

| Today | See what it's worth now |
| 1 Apr 2026 | £215,000 |
| 23 Dec 2010 | £137,500 |
1, Hazel Close, Woodbridge IP12 2UR
| Today | See what it's worth now |
| 27 Mar 2026 | £260,000 |
| 27 Mar 2020 | £220,000 |
3, Knight Road, Woodbridge IP12 2GR
| Today | See what it's worth now |
| 27 Mar 2026 | £490,000 |
| 2 Dec 2013 | £307,000 |
8, Tower Field Road, Woodbridge IP12 2UL

| Today | See what it's worth now |
| 27 Mar 2026 | £240,000 |
| 15 Sep 2017 | £190,000 |
33, Fountain Road, Woodbridge IP12 2UF
| Today | See what it's worth now |
| 25 Mar 2026 | £340,000 |
| 12 Jul 2016 | £234,200 |
11, Crooked Creek Road, Woodbridge IP12 2GL
| Today | See what it's worth now |
| 25 Mar 2026 | £290,000 |
| 29 Sep 2006 | £160,000 |
No other historical records.
58, Acer Road, Woodbridge IP12 2GA
| Today | See what it's worth now |
| 23 Mar 2026 | £438,500 |
| 26 Nov 2021 | £406,000 |
47, Crooked Creek Road, Woodbridge IP12 2GL
| Today | See what it's worth now |
| 16 Mar 2026 | £300,000 |
| 27 Oct 2006 | £185,000 |
No other historical records.
5, Beck Close, Woodbridge IP12 2UE
| Today | See what it's worth now |
| 27 Feb 2026 | £315,000 |
| 31 Aug 2017 | £194,000 |
22, Hazel Close, Woodbridge IP12 2UR
| Today | See what it's worth now |
| 20 Feb 2026 | £310,000 |
| 5 Jun 2006 | £169,950 |
14, Ashton Close, Woodbridge IP12 2GS
| Today | See what it's worth now |
| 20 Feb 2026 | £462,500 |
| 27 Jun 2006 | £295,000 |
No other historical records.
27, Pine Close, Woodbridge IP12 2GD
| Today | See what it's worth now |
| 9 Feb 2026 | £312,500 |
| 27 Jul 2004 | £169,995 |
No other historical records.
5, Avocet Mews, Woodbridge IP12 2UA
| Today | See what it's worth now |
| 6 Feb 2026 | £95,000 |
| 27 May 2016 | £73,000 |
8, Park Close, Woodbridge IP12 2UG
| Today | See what it's worth now |
| 3 Feb 2026 | £310,000 |
| 22 Mar 2002 | £94,950 |
No other historical records.
Woodbridge Lodge, School Lane, Woodbridge IP12 2RA
| Today | See what it's worth now |
| 16 Jan 2026 | £958,000 |
| 17 Feb 2021 | £780,000 |
No other historical records.
42, Spencer Road, Woodbridge IP12 2TJ
| Today | See what it's worth now |
| 17 Dec 2025 | £160,000 |
| 28 Apr 2006 | £85,000 |
214, Red House Cottages, Hollesley Road, Woodbridge IP12 2RL
| Today | See what it's worth now |
| 16 Dec 2025 | £315,000 |
| 23 Oct 2020 | £265,000 |
No other historical records.
18, Sycamore Drive, Woodbridge IP12 2GF
| Today | See what it's worth now |
| 3 Dec 2025 | £455,000 |
| 4 Feb 2009 | £280,000 |
No other historical records.
116, Redwald Road, Woodbridge IP12 2TF
| Today | See what it's worth now |
| 20 Nov 2025 | £257,500 |
| 31 Mar 2014 | £145,000 |
No other historical records.
2, Pine Close, Woodbridge IP12 2GD
| Today | See what it's worth now |
| 17 Nov 2025 | £405,000 |
| 17 Feb 2006 | £200,000 |
2, Wacker Field Road, Woodbridge IP12 2UT
| Today | See what it's worth now |
| 14 Nov 2025 | £378,500 |
| 10 Oct 2014 | £244,500 |
10, Jays Croft Road, Woodbridge IP12 2TQ
| Today | See what it's worth now |
| 10 Nov 2025 | £252,500 |
| 21 Jul 2017 | £192,000 |
34 Moss House, Hercules Road, Woodbridge IP12 2GP
| Today | See what it's worth now |
| 10 Nov 2025 | £385,000 |
| 1 Mar 2006 | £205,000 |
No other historical records.
Source Acknowledgement: © Crown copyright. England and Wales house price data is publicly available information produced by the HM Land Registry.This material was last updated on 9 July 2026. It covers the period from 1 January 1995 to 30 April 2026 and contains property transactions which have been registered during that period. Contains HM Land Registry data © Crown copyright and database right 2026. This data is licensed under the Open Government Licence v3.0.
Disclaimer: Rightmove.co.uk provides this HM Land Registry data "as is". The burden for fitness of the data relies completely with the user and is provided for informational purposes only. No warranty, express or implied, is given relating to the accuracy of content of the HM Land Registry data and Rightmove does not accept any liability for error or omission. If you have found an error with the data or need further information please contact HM Land Registry.
Permitted Use: Viewers of this Information are granted permission to access this Crown copyright material and to download it onto electronic, magnetic, optical or similar storage media provided that such activities are for private research, study or in-house use only. Any other use of the material requires the formal written permission of Land Registry which can be requested from us, and is subject to an additional licence and associated charge.
Rightmove takes no liability for your use of, or reliance on, Rightmove's Instant Valuation due to the limitations of our tracking tool listed here. Use of this tool is taken entirely at your own risk. All rights reserved.