
House Prices in Revidge
House prices in Revidge have an overall average of £187,571 over the last year.
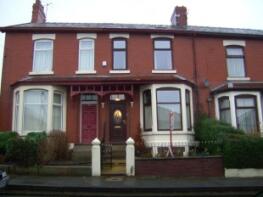
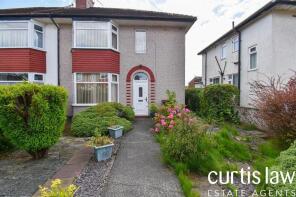
The majority of properties sold in Revidge during the last year were semi-detached properties, selling for an average price of £217,549. Terraced properties sold for an average of £140,268, with flats fetching £97,000.
Overall, the historical sold prices in Revidge over the last year were similar to the previous year and 3% up on the 2023 peak of £181,575.
Properties Sold
130, Downham Street, Blackburn BB2 6NY
| Today | See what it's worth now |
| 17 Apr 2026 | £150,000 |
| 26 May 2006 | £105,000 |
No other historical records.
72, Openshaw Drive, Blackburn BB1 8RH
| Today | See what it's worth now |
| 2 Apr 2026 | £235,000 |
| 30 Jul 1999 | £49,000 |
No other historical records.
116, Dukes Brow, Blackburn BB2 6DJ
| Today | See what it's worth now |
| 27 Mar 2026 | £128,000 |
| 21 Feb 2022 | £90,000 |
12, Grasmere Avenue, Blackburn BB1 8LD
| Today | See what it's worth now |
| 27 Mar 2026 | £205,500 |
| 27 Mar 2000 | £68,950 |
No other historical records.
18, Livingstone Road, Blackburn BB2 6NF
| Today | See what it's worth now |
| 16 Mar 2026 | £130,000 |
| 5 Mar 2003 | £57,500 |
No other historical records.
37, Deganwy Avenue, Blackburn BB1 8EU
| Today | See what it's worth now |
| 10 Mar 2026 | £184,000 |
No other historical records.
21, Revidge Road, Blackburn BB2 6JB

| Today | See what it's worth now |
| 10 Mar 2026 | £245,000 |
| 21 Mar 2025 | £185,000 |
32, Grasmere Avenue, Blackburn BB1 8LD
| Today | See what it's worth now |
| 6 Mar 2026 | £300,000 |
| 24 Sep 2009 | £148,000 |
No other historical records.
5, Mavis Road, Blackburn BB2 6SW
| Today | See what it's worth now |
| 27 Feb 2026 | £350,000 |
| 24 Jun 2022 | £290,000 |
5, Kestrel Close, Blackburn BB1 8LG
| Today | See what it's worth now |
| 27 Feb 2026 | £105,000 |
| 3 Jun 1999 | £40,000 |
No other historical records.
131, Dukes Brow, Blackburn BB2 6DJ
| Today | See what it's worth now |
| 20 Feb 2026 | £250,000 |
| 15 Oct 1999 | £18,000 |
No other historical records.
137, St James's Road, Blackburn BB1 8ET

| Today | See what it's worth now |
| 17 Feb 2026 | £120,000 |
No other historical records.
83, Openshaw Drive, Blackburn BB1 8RB
| Today | See what it's worth now |
| 17 Feb 2026 | £181,000 |
| 18 Aug 2006 | £123,500 |
201, Addison Street, Blackburn BB2 1HJ
| Today | See what it's worth now |
| 16 Feb 2026 | £117,500 |
| 19 Nov 1999 | £18,000 |
9, Pall Mall, Billinge End Road, Blackburn BB2 6QD
| Today | See what it's worth now |
| 6 Feb 2026 | £265,000 |
| 17 Dec 2020 | £246,000 |
16, Taunton Road, Blackburn BB2 6NN
| Today | See what it's worth now |
| 5 Feb 2026 | £160,000 |
| 29 Apr 2016 | £123,000 |
101, Ramsgreave Drive, Blackburn BB1 8NA
| Today | See what it's worth now |
| 30 Jan 2026 | £280,000 |
| 23 Mar 2004 | £130,000 |
No other historical records.
14, Wain Court, Livingstone Road, Blackburn BB2 6NE
| Today | See what it's worth now |
| 30 Jan 2026 | £131,500 |
No other historical records.
12, West View Place, Blackburn BB2 6JG
| Today | See what it's worth now |
| 30 Jan 2026 | £131,000 |
| 26 Jul 2024 | £100,000 |
3, Billinge Avenue, Blackburn BB2 6SD
| Today | See what it's worth now |
| 28 Jan 2026 | £375,000 |
| 31 Jan 2022 | £265,000 |
No other historical records.
7, Gibraltar Street, Blackburn BB2 6HF
| Today | See what it's worth now |
| 16 Jan 2026 | £156,500 |
| 9 Jun 1997 | £28,500 |
No other historical records.
6, St Marks Place, Blackburn BB2 6TA
| Today | See what it's worth now |
| 9 Jan 2026 | £140,000 |
| 15 Dec 2022 | £125,000 |
1, Whinney Lane, Blackburn BB2 7BX
| Today | See what it's worth now |
| 9 Jan 2026 | £164,000 |
| 26 Nov 2015 | £113,000 |
Source Acknowledgement: © Crown copyright. England and Wales house price data is publicly available information produced by the HM Land Registry.This material was last updated on 9 July 2026. It covers the period from 1 January 1995 to 30 April 2026 and contains property transactions which have been registered during that period. Contains HM Land Registry data © Crown copyright and database right 2026. This data is licensed under the Open Government Licence v3.0.
Disclaimer: Rightmove.co.uk provides this HM Land Registry data "as is". The burden for fitness of the data relies completely with the user and is provided for informational purposes only. No warranty, express or implied, is given relating to the accuracy of content of the HM Land Registry data and Rightmove does not accept any liability for error or omission. If you have found an error with the data or need further information please contact HM Land Registry.
Permitted Use: Viewers of this Information are granted permission to access this Crown copyright material and to download it onto electronic, magnetic, optical or similar storage media provided that such activities are for private research, study or in-house use only. Any other use of the material requires the formal written permission of Land Registry which can be requested from us, and is subject to an additional licence and associated charge.
Rightmove takes no liability for your use of, or reliance on, Rightmove's Instant Valuation due to the limitations of our tracking tool listed here. Use of this tool is taken entirely at your own risk. All rights reserved.