
House Prices in Ripley
House prices in Ripley have an overall average of £212,865 over the last year.
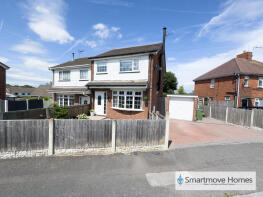
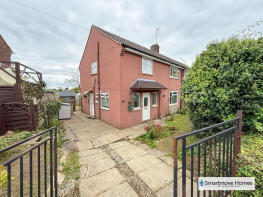
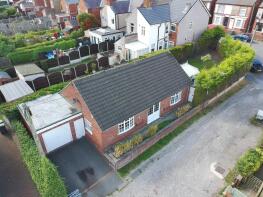
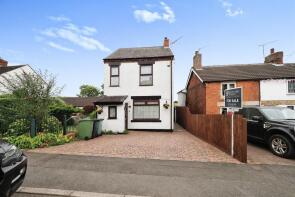
The majority of properties sold in Ripley during the last year were semi-detached properties, selling for an average price of £199,679. Terraced properties sold for an average of £160,693, with detached properties fetching £296,104.
Overall, the historical sold prices in Ripley over the last year were 8% down on the previous year and 4% down on the 2023 peak of £221,513.
Properties Sold
23, Crossley Street, Ripley DE5 3EE

| Today | See what it's worth now |
| 20 Mar 2026 | £112,000 |
| 18 May 2001 | £29,950 |
No other historical records.
175, Derby Road, Ripley DE5 8HU
| Today | See what it's worth now |
| 13 Mar 2026 | £147,500 |
| 20 Jan 2022 | £135,000 |
18, Wood Street, Ripley DE5 3DD
| Today | See what it's worth now |
| 6 Mar 2026 | £155,000 |
| 25 Nov 2022 | £111,000 |
99, Butterley Hill, Ripley DE5 3LW
| Today | See what it's worth now |
| 6 Mar 2026 | £205,000 |
| 10 Jan 2014 | £50,000 |
No other historical records.
81, Highfield Way, Ripley DE5 3RT
| Today | See what it's worth now |
| 3 Mar 2026 | £245,000 |
| 23 Jan 2009 | £136,000 |
No other historical records.
31, The Gardens, Marehay, Ripley DE5 8JW
| Today | See what it's worth now |
| 27 Feb 2026 | £180,000 |
| 11 Nov 2016 | £130,000 |
46, Denby Bank, Marehay, Ripley DE5 8LD
| Today | See what it's worth now |
| 27 Feb 2026 | £230,000 |
| 27 Sep 2019 | £186,500 |
4, Amber Heights, Ripley DE5 3SP
| Today | See what it's worth now |
| 27 Feb 2026 | £225,000 |
| 15 Aug 2003 | £135,950 |
14, Northam Drive, Ripley DE5 3SD
| Today | See what it's worth now |
| 27 Feb 2026 | £295,000 |
| 19 Oct 2018 | £183,000 |
85, Warmwells Lane, Marehay, Ripley DE5 8JB
| Today | See what it's worth now |
| 27 Feb 2026 | £155,000 |
| 18 Apr 2007 | £105,000 |
99, Heage Road, Ripley DE5 3GE
| Today | See what it's worth now |
| 27 Feb 2026 | £290,000 |
| 22 Jun 2016 | £140,000 |
97, Street Lane, Denby, Ripley DE5 8NF
| Today | See what it's worth now |
| 27 Feb 2026 | £306,500 |
| 24 Aug 2015 | £160,000 |
6, Ford Close, Ripley DE5 3RX
| Today | See what it's worth now |
| 26 Feb 2026 | £239,950 |
| 6 Aug 2019 | £183,500 |
The Cottage, Coach Road, Butterley Park, Ripley DE5 3QU
| Today | See what it's worth now |
| 26 Feb 2026 | £400,000 |
No other historical records.
8, Steam Mill Lane, Ripley DE5 3JR
| Today | See what it's worth now |
| 25 Feb 2026 | £265,000 |
| 6 Sep 1996 | £59,995 |
No other historical records.
146, Derby Road, Ripley DE5 3HT
| Today | See what it's worth now |
| 24 Feb 2026 | £205,000 |
| 22 Jul 2022 | £185,000 |
27, Bridle Lane, Greenwich, Ripley DE5 3BL
| Today | See what it's worth now |
| 23 Feb 2026 | £155,000 |
| 17 Nov 1995 | £34,000 |
No other historical records.
110, Church Street, Waingroves, Ripley DE5 9TE
| Today | See what it's worth now |
| 23 Feb 2026 | £410,000 |
No other historical records.
144, Church Street, Waingroves, Ripley DE5 9TE
| Today | See what it's worth now |
| 23 Feb 2026 | £285,000 |
| 27 May 2005 | £145,000 |
No other historical records.
73, Park Street, Ripley DE5 3ES

| Today | See what it's worth now |
| 20 Feb 2026 | £130,000 |
| 16 Mar 2004 | £64,000 |
No other historical records.
28, Lyndale Drive, Codnor, Ripley DE5 9QJ
| Today | See what it's worth now |
| 19 Feb 2026 | £214,000 |
| 20 Jul 2007 | £125,000 |
17, Willow Avenue, Ripley DE5 3PT
| Today | See what it's worth now |
| 18 Feb 2026 | £180,000 |
No other historical records.
4, Manvers Avenue, Ripley DE5 3ER
| Today | See what it's worth now |
| 18 Feb 2026 | £244,000 |
| 29 Jun 2023 | £185,000 |
No other historical records.
Source Acknowledgement: © Crown copyright. England and Wales house price data is publicly available information produced by the HM Land Registry.This material was last updated on 15 May 2026. It covers the period from 1 January 1995 to 31 March 2026 and contains property transactions which have been registered during that period. Contains HM Land Registry data © Crown copyright and database right 2026. This data is licensed under the Open Government Licence v3.0.
Disclaimer: Rightmove.co.uk provides this HM Land Registry data "as is". The burden for fitness of the data relies completely with the user and is provided for informational purposes only. No warranty, express or implied, is given relating to the accuracy of content of the HM Land Registry data and Rightmove does not accept any liability for error or omission. If you have found an error with the data or need further information please contact HM Land Registry.
Permitted Use: Viewers of this Information are granted permission to access this Crown copyright material and to download it onto electronic, magnetic, optical or similar storage media provided that such activities are for private research, study or in-house use only. Any other use of the material requires the formal written permission of Land Registry which can be requested from us, and is subject to an additional licence and associated charge.
Rightmove takes no liability for your use of, or reliance on, Rightmove's Instant Valuation due to the limitations of our tracking tool listed here. Use of this tool is taken entirely at your own risk. All rights reserved.