
House Prices in Roast Green
House prices in Roast Green have an overall average of £560,525 over the last year.
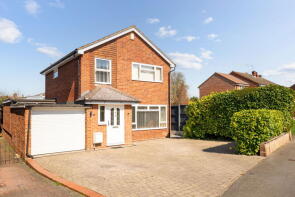
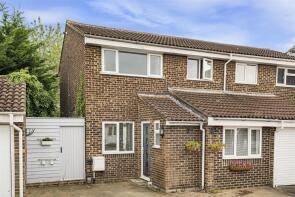
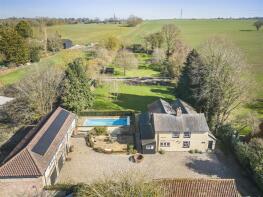
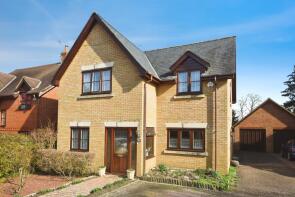
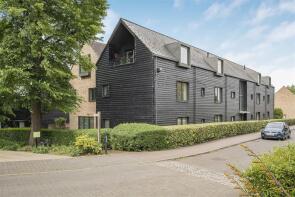
The majority of properties sold in Roast Green during the last year were detached properties, selling for an average price of £750,953. Terraced properties sold for an average of £379,133, with semi-detached properties fetching £504,222.
Overall, the historical sold prices in Roast Green over the last year were 7% down on the previous year and 12% down on the 2022 peak of £637,283.
Properties Sold
39, Cromwell Road, Saffron Walden CB11 4AX
| Today | See what it's worth now |
| 15 Apr 2026 | £500,000 |
| 25 Sep 1997 | £85,000 |
No other historical records.
Aquaside, Clanver End, Arkesden Road, Saffron Walden CB11 4UL
| Today | See what it's worth now |
| 15 Apr 2026 | £715,000 |
| 16 May 2014 | £467,500 |
93, Loompits Way, Saffron Walden CB11 4DN

| Today | See what it's worth now |
| 2 Apr 2026 | £237,000 |
| 29 Aug 2023 | £219,000 |
26, Pleasant Valley, Saffron Walden CB11 4AP
| Today | See what it's worth now |
| 1 Apr 2026 | £575,000 |
| 17 Oct 2014 | £410,000 |
12, Burgess Croft, Saffron Walden CB11 4GJ
| Today | See what it's worth now |
| 30 Mar 2026 | £340,000 |
| 29 Apr 2014 | £290,000 |
No other historical records.
Old School House, Royston Road, Saffron Walden CB11 4JX
| Today | See what it's worth now |
| 27 Mar 2026 | £1,650,000 |
| 19 Feb 2003 | £567,500 |
No other historical records.
Catkins, Strethall Road, Littlebury CB11 4TQ
| Today | See what it's worth now |
| 18 Mar 2026 | £610,000 |
No other historical records.
The Gables, Clatterbury Lane, Saffron Walden CB11 4QU
| Today | See what it's worth now |
| 12 Mar 2026 | £695,000 |
| 30 May 2012 | £492,500 |
No other historical records.
4, Gallows Hill, Saffron Walden CB11 4DA
| Today | See what it's worth now |
| 4 Mar 2026 | £756,690 |
| 4 Apr 2012 | £495,000 |
No other historical records.
2, Loompits Way, Saffron Walden CB11 4BZ
| Today | See what it's worth now |
| 4 Mar 2026 | £630,000 |
| 27 Mar 2020 | £466,000 |
No other historical records.
61, Winstanley Road, Saffron Walden CB11 3EX
| Today | See what it's worth now |
| 27 Feb 2026 | £380,000 |
| 20 Dec 2019 | £270,000 |
47, Cromwell Road, Saffron Walden CB11 4AX

| Today | See what it's worth now |
| 4 Feb 2026 | £285,000 |
| 20 Apr 2017 | £285,000 |
118, Loompits Way, Saffron Walden CB11 4DN
| Today | See what it's worth now |
| 9 Jan 2026 | £230,000 |
| 27 Apr 2022 | £206,000 |
76, Loompits Way, Saffron Walden CB11 4DP
| Today | See what it's worth now |
| 6 Jan 2026 | £300,000 |
No other historical records.
4, Little Larchmount, Saffron Walden CB11 4EF
| Today | See what it's worth now |
| 19 Dec 2025 | £240,000 |
| 29 Jun 2015 | £187,000 |
9, Mount Pleasant Cottages, Saffron Walden CB11 4AE
| Today | See what it's worth now |
| 19 Dec 2025 | £460,000 |
| 19 Dec 2025 | £460,000 |
5, Loompits Way, Saffron Walden CB11 4BZ
| Today | See what it's worth now |
| 19 Dec 2025 | £755,000 |
| 27 Apr 2016 | £525,000 |
No other historical records.
58, Beeches Close, Saffron Walden CB11 4BT
| Today | See what it's worth now |
| 19 Dec 2025 | £540,000 |
No other historical records.
40, Debden Road, Saffron Walden CB11 4AB
| Today | See what it's worth now |
| 17 Dec 2025 | £300,030 |
| 19 Mar 2004 | £137,500 |
21, Stephen Neville Court, Saffron Walden CB11 4DX
| Today | See what it's worth now |
| 12 Dec 2025 | £340,000 |
| 3 Oct 2014 | £245,000 |
113, Ross Close, Saffron Walden CB11 4DU
| Today | See what it's worth now |
| 12 Dec 2025 | £345,000 |
| 24 Aug 2016 | £262,000 |
No other historical records.
Druce Croft, The Druce, Clavering CB11 4QP
| Today | See what it's worth now |
| 5 Dec 2025 | £1,020,000 |
No other historical records.
8a, Peggys Walk, Saffron Walden CB11 4TG
| Today | See what it's worth now |
| 4 Dec 2025 | £661,500 |
| 9 Sep 2005 | £395,000 |
Source Acknowledgement: © Crown copyright. England and Wales house price data is publicly available information produced by the HM Land Registry.This material was last updated on 9 July 2026. It covers the period from 1 January 1995 to 30 April 2026 and contains property transactions which have been registered during that period. Contains HM Land Registry data © Crown copyright and database right 2026. This data is licensed under the Open Government Licence v3.0.
Disclaimer: Rightmove.co.uk provides this HM Land Registry data "as is". The burden for fitness of the data relies completely with the user and is provided for informational purposes only. No warranty, express or implied, is given relating to the accuracy of content of the HM Land Registry data and Rightmove does not accept any liability for error or omission. If you have found an error with the data or need further information please contact HM Land Registry.
Permitted Use: Viewers of this Information are granted permission to access this Crown copyright material and to download it onto electronic, magnetic, optical or similar storage media provided that such activities are for private research, study or in-house use only. Any other use of the material requires the formal written permission of Land Registry which can be requested from us, and is subject to an additional licence and associated charge.
Rightmove takes no liability for your use of, or reliance on, Rightmove's Instant Valuation due to the limitations of our tracking tool listed here. Use of this tool is taken entirely at your own risk. All rights reserved.