
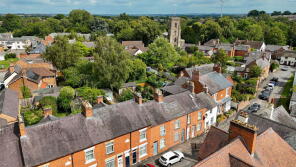
House Prices in Rothley
House prices in Rothley have an overall average of £393,754 over the last year.
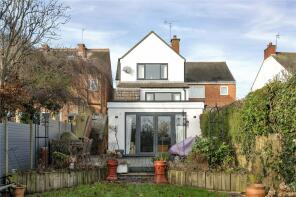
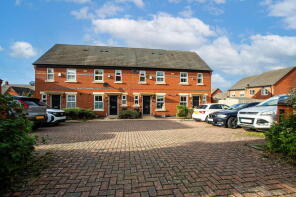
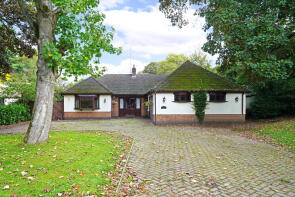
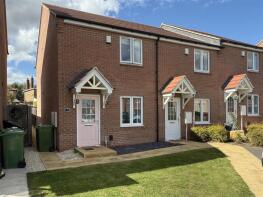
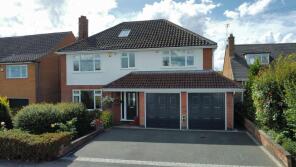
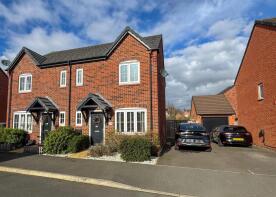
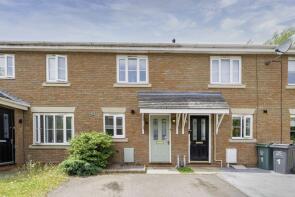
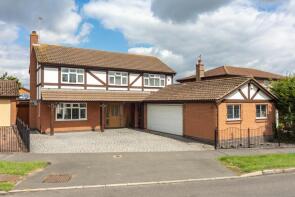
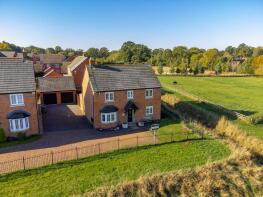
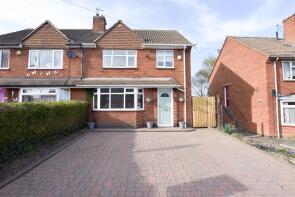
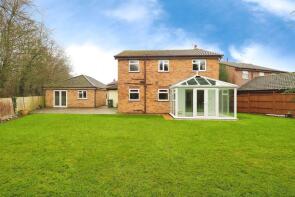
The majority of properties sold in Rothley during the last year were detached properties, selling for an average price of £485,139. Semi-detached properties sold for an average of £327,284, with terraced properties fetching £263,056.
Overall, the historical sold prices in Rothley over the last year were 19% down on the previous year and 11% down on the 2023 peak of £442,343.
Properties Sold
6, Appleyard Close, Leicester LE7 7XT
| Today | See what it's worth now |
| 30 Mar 2026 | £375,000 |
| 14 Jun 2019 | £284,950 |
No other historical records.
36, Armitage Drive, Leicester LE7 7ST
| Today | See what it's worth now |
| 27 Mar 2026 | £270,000 |
| 29 Apr 2015 | £208,000 |
5, Bates Hollow, Leicester LE7 7RT
| Today | See what it's worth now |
| 20 Mar 2026 | £355,000 |
| 9 Oct 2020 | £310,000 |
213, Swithland Lane, Leicester LE7 7SJ
| Today | See what it's worth now |
| 27 Feb 2026 | £590,000 |
| 4 Jul 2019 | £460,000 |
25, Town Green Street, Leicester LE7 7NU
| Today | See what it's worth now |
| 27 Feb 2026 | £390,000 |
| 5 Aug 2022 | £420,000 |
No other historical records.
2, Damson Close, Leicester LE7 7SZ
| Today | See what it's worth now |
| 26 Feb 2026 | £355,000 |
| 26 Jan 2017 | £249,995 |
No other historical records.
12, Kitson Lane, Broadnook, Wanlip LE7 6AB
| Today | See what it's worth now |
| 18 Feb 2026 | £200,000 |
| 21 Mar 2025 | £399,995 |
No other historical records.
4, Burtons Road, Leicester LE7 7SY
| Today | See what it's worth now |
| 9 Feb 2026 | £270,000 |
| 29 Nov 2020 | £227,000 |
50, Templar Way, Leicester LE7 7RB
| Today | See what it's worth now |
| 30 Jan 2026 | £438,000 |
| 16 Nov 2004 | £275,000 |
42, Woodgate, Leicester LE7 7LJ
| Today | See what it's worth now |
| 28 Jan 2026 | £190,000 |
| 23 Jun 2023 | £189,000 |
54, Woodgate, Leicester LE7 7LJ
| Today | See what it's worth now |
| 12 Jan 2026 | £382,000 |
| 25 Aug 1995 | £69,000 |
No other historical records.
18, Merttens Drive, Leicester LE7 7SX
| Today | See what it's worth now |
| 9 Jan 2026 | £227,000 |
| 12 Feb 2021 | £192,000 |
53a, Swithland Lane, Leicester LE7 7SG
| Today | See what it's worth now |
| 9 Jan 2026 | £700,000 |
| 9 Apr 1998 | £167,500 |
No other historical records.
149, Swithland Lane, Leicester LE7 7SH

| Today | See what it's worth now |
| 7 Jan 2026 | £795,000 |
| 30 Apr 2010 | £590,000 |
10, Anthony Street, Leicester LE7 7PA
| Today | See what it's worth now |
| 2 Jan 2026 | £250,000 |
| 10 Dec 2021 | £215,000 |
No other historical records.
1, Warwick Close, Leicester LE7 7WP
| Today | See what it's worth now |
| 19 Dec 2025 | £238,000 |
| 25 Sep 2020 | £200,000 |
No other historical records.
24, Templar Way, Leicester LE7 7RB
| Today | See what it's worth now |
| 18 Dec 2025 | £630,000 |
| 5 Jul 2001 | £202,500 |
74, Baum Drive, Loughborough LE12 7XW
| Today | See what it's worth now |
| 12 Dec 2025 | £265,000 |
| 29 Mar 2018 | £214,995 |
No other historical records.
18, Chester Avenue, Wanlip LE7 6AU
| Today | See what it's worth now |
| 12 Dec 2025 | £337,245 |
No other historical records.
3, The Pyke, Leicester LE7 7LY
| Today | See what it's worth now |
| 10 Dec 2025 | £219,000 |
| 7 Apr 2022 | £207,000 |
9, Carisbrooke Road, Loughborough LE12 7BR
| Today | See what it's worth now |
| 10 Dec 2025 | £610,000 |
| 30 Nov 2000 | £160,000 |
No other historical records.
1, Brookfield Road, Leicester LE7 7RX
| Today | See what it's worth now |
| 3 Dec 2025 | £598,000 |
| 30 Nov 2017 | £435,000 |
73, Woodfield Road, Leicester LE7 7RD
| Today | See what it's worth now |
| 28 Nov 2025 | £302,500 |
| 26 Feb 2024 | £285,000 |

Source Acknowledgement: © Crown copyright. England and Wales house price data is publicly available information produced by the HM Land Registry.This material was last updated on 9 July 2026. It covers the period from 1 January 1995 to 30 April 2026 and contains property transactions which have been registered during that period. Contains HM Land Registry data © Crown copyright and database right 2026. This data is licensed under the Open Government Licence v3.0.
Disclaimer: Rightmove.co.uk provides this HM Land Registry data "as is". The burden for fitness of the data relies completely with the user and is provided for informational purposes only. No warranty, express or implied, is given relating to the accuracy of content of the HM Land Registry data and Rightmove does not accept any liability for error or omission. If you have found an error with the data or need further information please contact HM Land Registry.
Permitted Use: Viewers of this Information are granted permission to access this Crown copyright material and to download it onto electronic, magnetic, optical or similar storage media provided that such activities are for private research, study or in-house use only. Any other use of the material requires the formal written permission of Land Registry which can be requested from us, and is subject to an additional licence and associated charge.
Rightmove takes no liability for your use of, or reliance on, Rightmove's Instant Valuation due to the limitations of our tracking tool listed here. Use of this tool is taken entirely at your own risk. All rights reserved.