
House Prices in SO40 2NN
House prices in SO40 2NN have an overall average of £736,106 over the last year.
Overall, the historical sold prices in SO40 2NN over the last year were 29% up on the 2022 peak of £572,667.
Properties Sold
Old Oak Farm, Romsey Road, Cadnam SO40 2NN
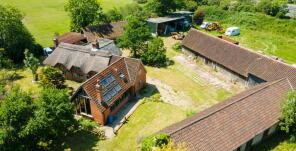
| Today | See what it's worth now |
| 9 Jun 2025 | £872,211 |
No other historical records.
Squirrels Chase, Romsey Road, Southampton SO40 2NN
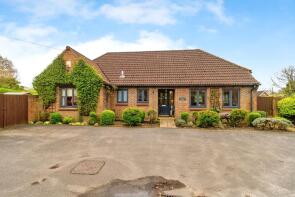
| Today | See what it's worth now |
| 14 Mar 2025 | £600,000 |
| 4 Aug 1997 | £150,000 |
No other historical records.
Treeside, Romsey Road, Southampton SO40 2NN

| Today | See what it's worth now |
| 22 Aug 2023 | £570,000 |
| 2 Feb 2022 | £560,000 |
No other historical records.
Saguenay, Romsey Road, Southampton SO40 2NN
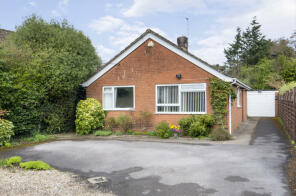
| Today | See what it's worth now |
| 22 Aug 2022 | £418,000 |
| 24 Nov 2017 | £363,000 |
Green Gables, Romsey Road, Southampton SO40 2NN
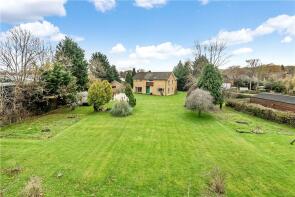
| Today | See what it's worth now |
| 26 May 2022 | £740,000 |
No other historical records.
Oakwood, Romsey Road, Southampton SO40 2NN

| Today | See what it's worth now |
| 3 Dec 2021 | £415,000 |
| 5 Oct 2001 | £171,500 |
No other historical records.
Hillview, Romsey Road, Southampton SO40 2NN
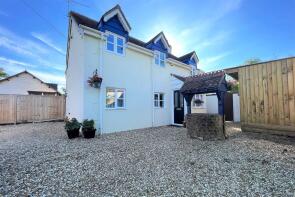
| Today | See what it's worth now |
| 12 Aug 2021 | £435,000 |
| 13 Jul 2007 | £337,000 |
Santa Maria, Romsey Road, Southampton SO40 2NN
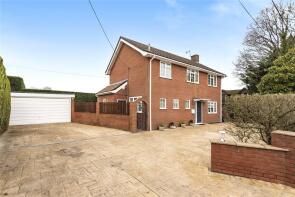
| Today | See what it's worth now |
| 16 Apr 2021 | £550,000 |
| 3 Aug 2006 | £282,000 |
Teresa, Romsey Road, Southampton SO40 2NN
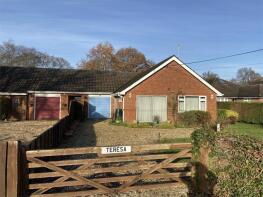
| Today | See what it's worth now |
| 11 Dec 2020 | £425,000 |
No other historical records.
Hollybrook Cottage, Romsey Road, Southampton SO40 2NN

| Today | See what it's worth now |
| 4 Dec 2020 | £610,000 |
| 19 Nov 2015 | £510,000 |
Midway, Romsey Road, Southampton SO40 2NN
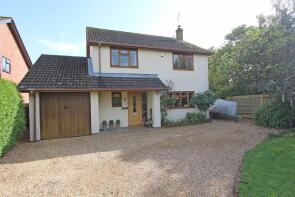
| Today | See what it's worth now |
| 3 Jul 2020 | £560,000 |
| 21 Jul 2006 | £340,000 |
No other historical records.
Rose Tree Cottage, Romsey Road, Southampton SO40 2NN

| Today | See what it's worth now |
| 27 Mar 2020 | £357,000 |
No other historical records.
Amberley, Romsey Road, Southampton SO40 2NN

| Today | See what it's worth now |
| 18 Dec 2019 | £440,000 |
| 20 Nov 2009 | £290,000 |
No other historical records.
Forest Edge, Romsey Road, Southampton SO40 2NN

| Today | See what it's worth now |
| 3 Oct 2016 | £535,000 |
| 8 Nov 2007 | £439,950 |
No other historical records.
Glen Rhyn, Romsey Road, Southampton SO40 2NN

| Today | See what it's worth now |
| 15 Apr 2016 | £432,000 |
| 6 Aug 2010 | £300,000 |
No other historical records.
Forest Rise, Romsey Road, Southampton SO40 2NN
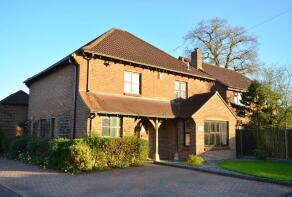
| Today | See what it's worth now |
| 23 Oct 2015 | £504,000 |
| 26 Nov 2009 | £437,500 |
Myrtle Cottage, Romsey Road, Southampton SO40 2NN

| Today | See what it's worth now |
| 24 May 2013 | £400,000 |
| 25 Jul 1997 | £128,000 |
No other historical records.
Deer Leap, Romsey Road, Southampton SO40 2NN

| Today | See what it's worth now |
| 12 Oct 2010 | £330,000 |
No other historical records.
Yewtree Cottage, Romsey Road, Southampton SO40 2NN
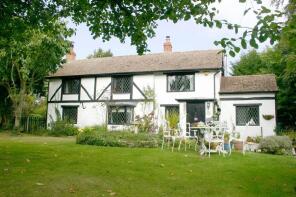
| Today | See what it's worth now |
| 17 Feb 2010 | £490,000 |
| 24 May 2000 | £300,000 |
No other historical records.
Forest Gates, Romsey Road, Southampton SO40 2NN
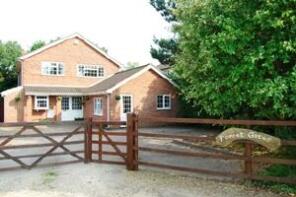
| Today | See what it's worth now |
| 29 Jan 2010 | £414,000 |
| 5 Nov 2003 | £330,000 |
Belle Vue, Romsey Road, Southampton SO40 2NN
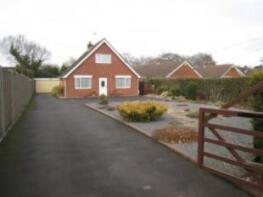
| Today | See what it's worth now |
| 19 Jun 2009 | £290,000 |
| 8 Feb 2001 | £185,000 |
No other historical records.
Nuttlebury, Romsey Road, Southampton SO40 2NN

| Today | See what it's worth now |
| 30 Sep 2008 | £417,500 |
| 25 Nov 2005 | £440,000 |
Magpies, Romsey Road, Southampton SO40 2NN

| Today | See what it's worth now |
| 29 Sep 2006 | £419,000 |
No other historical records.
The Gables, Romsey Road, Southampton SO40 2NN

| Today | See what it's worth now |
| 9 Apr 1999 | £150,000 |
No other historical records.
Chalvington House, Romsey Road, Southampton SO40 2NN

| Today | See what it's worth now |
| 19 Mar 1999 | £194,950 |
No other historical records.
Find out how much your property is worth
The following agents can provide you with a free, no-obligation valuation. Simply select the ones you'd like to hear from.
Sponsored
All featured agents have paid a fee to promote their valuation expertise.

Hamwic Independent Estate Agents
Totton

Goadsby
Southampton

Pococks
Marchwood

Citrine Estates
Hythe

Mann
Totton

SDM PROPERTY LTD
Covering Southampton
Get ready with a Mortgage in Principle
- Personalised result in just 20 minutes
- Find out how much you can borrow
- Get viewings faster with agents
- No impact on your credit score
What's your property worth?
Source Acknowledgement: © Crown copyright. England and Wales house price data is publicly available information produced by the HM Land Registry.This material was last updated on 2 December 2025. It covers the period from 1 January 1995 to 31 October 2025 and contains property transactions which have been registered during that period. Contains HM Land Registry data © Crown copyright and database right 2026. This data is licensed under the Open Government Licence v3.0.
Disclaimer: Rightmove.co.uk provides this HM Land Registry data "as is". The burden for fitness of the data relies completely with the user and is provided for informational purposes only. No warranty, express or implied, is given relating to the accuracy of content of the HM Land Registry data and Rightmove does not accept any liability for error or omission. If you have found an error with the data or need further information please contact HM Land Registry.
Permitted Use: Viewers of this Information are granted permission to access this Crown copyright material and to download it onto electronic, magnetic, optical or similar storage media provided that such activities are for private research, study or in-house use only. Any other use of the material requires the formal written permission of Land Registry which can be requested from us, and is subject to an additional licence and associated charge.
Data on planning applications, home extensions and build costs is provided by Resi.co.uk. Planning data is calculated using the last 2 years of residential applications within the selected planning authority. Home extension data, such as build costs and project timelines, are calculated using approximately 9,000 architectural projects Resi has completed, and 23,500 builders quotes submitted via Resi's platform. Build costs are adjusted according to inflation rates to more accurately represent today's prices.
Map data ©OpenStreetMap contributors.
Rightmove takes no liability for your use of, or reliance on, Rightmove's Instant Valuation due to the limitations of our tracking tool listed here. Use of this tool is taken entirely at your own risk. All rights reserved.

