
House Prices in SO18
House prices in SO18 have an overall average of £286,254 over the last year.
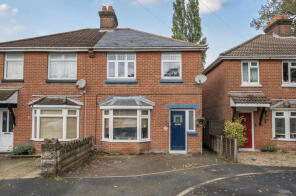
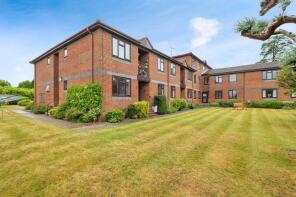
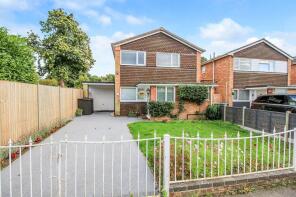
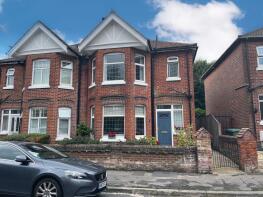
The majority of properties sold in SO18 during the last year were semi-detached properties, selling for an average price of £313,217. Detached properties sold for an average of £393,542, with flats fetching £153,888.
Overall, the historical sold prices in SO18 over the last year were 3% up on the previous year and 5% up on the 2022 peak of £272,801.
Properties Sold
15, Beech Avenue, Southampton SO18 4HR
| Today | See what it's worth now |
| 27 Apr 2026 | £270,000 |
| 1 May 2009 | £160,000 |
No other historical records.
4, Jubilee Gardens, Southampton SO18 6LX
| Today | See what it's worth now |
| 22 Apr 2026 | £330,000 |
| 13 Jul 2018 | £235,000 |
No other historical records.
69, Mansfield Park Street, Southampton SO18 5AE
| Today | See what it's worth now |
| 22 Apr 2026 | £175,000 |
| 15 Dec 2016 | £183,500 |
No other historical records.
Extensions and planning permission in SO18
See planning approval stats, extension build costs and value added estimates.

Flat 22, Home Spinney House, River View Road, Southampton SO18 1UD
| Today | See what it's worth now |
| 17 Apr 2026 | £61,500 |
| 28 Sep 2005 | £104,950 |
4, Clifton Gardens, West End SO18 3DA

| Today | See what it's worth now |
| 13 Apr 2026 | £416,000 |
| 27 Mar 2025 | £325,000 |
No other historical records.
100, Newton Road, Southampton SO18 1NG
| Today | See what it's worth now |
| 10 Apr 2026 | £358,000 |
| 5 Jan 2022 | £270,000 |
No other historical records.
4, Horne Close, Southampton SO18 3AE
| Today | See what it's worth now |
| 10 Apr 2026 | £375,000 |
| 3 Sep 2010 | £220,500 |
No other historical records.
36, Selborne Avenue, Southampton SO18 5EA
| Today | See what it's worth now |
| 10 Apr 2026 | £357,500 |
| 16 Apr 2007 | £162,000 |
26, Alpine Close, Southampton SO18 5QH

| Today | See what it's worth now |
| 10 Apr 2026 | £285,000 |
| 18 Mar 2021 | £240,000 |
7, Clanfield Road, Southampton SO18 5HB
| Today | See what it's worth now |
| 7 Apr 2026 | £167,500 |
No other historical records.
29, Torridge Gardens, Southampton SO18 3NF
| Today | See what it's worth now |
| 2 Apr 2026 | £254,000 |
| 29 Sep 2017 | £215,000 |
64, Torridge Gardens, Southampton SO18 3NF
| Today | See what it's worth now |
| 2 Apr 2026 | £285,000 |
| 4 Aug 2010 | £188,000 |
88, Glenfield Avenue, Southampton SO18 4EU
| Today | See what it's worth now |
| 2 Apr 2026 | £445,000 |
| 18 Feb 2022 | £465,000 |
Flat 15, Charden Court, York Drove, Southampton SO18 5LZ
| Today | See what it's worth now |
| 2 Apr 2026 | £147,500 |
| 20 Dec 2017 | £111,500 |
18, Coachmans Copse, Southampton SO18 2RQ

| Today | See what it's worth now |
| 31 Mar 2026 | £290,000 |
| 27 Nov 2015 | £175,000 |
No other historical records.
253, Bitterne Road West, Southampton SO18 1BP
| Today | See what it's worth now |
| 31 Mar 2026 | £250,000 |
| 10 Jun 2016 | £245,000 |
69, Riverdene Place, Southampton SO18 1UH

| Today | See what it's worth now |
| 31 Mar 2026 | £195,000 |
| 3 Sep 1996 | £63,500 |
No other historical records.
106, Dimond Road, Southampton SO18 1JX
| Today | See what it's worth now |
| 31 Mar 2026 | £293,000 |
| 5 Apr 2002 | £108,500 |
21, Monks Way, Southampton SO18 2LR
| Today | See what it's worth now |
| 31 Mar 2026 | £257,000 |
| 3 Mar 2025 | £155,000 |
195, West End Road, Southampton SO18 6QN
| Today | See what it's worth now |
| 31 Mar 2026 | £510,000 |
| 25 May 2021 | £510,000 |
No other historical records.
8, Arden Close, Southampton SO18 5QE
| Today | See what it's worth now |
| 30 Mar 2026 | £255,000 |
| 20 Jun 2008 | £176,000 |
11, Yew Road, Southampton SO18 6AW
| Today | See what it's worth now |
| 30 Mar 2026 | £310,000 |
| 26 Jun 2020 | £273,000 |
Flat 5, 80 Victor Court, Thornhill Park Road, Southampton SO18 5TW
| Today | See what it's worth now |
| 27 Mar 2026 | £112,500 |
| 27 Mar 1997 | £27,000 |
No other historical records.
Source Acknowledgement: © Crown copyright. England and Wales house price data is publicly available information produced by the HM Land Registry.This material was last updated on 9 July 2026. It covers the period from 1 January 1995 to 30 April 2026 and contains property transactions which have been registered during that period. Contains HM Land Registry data © Crown copyright and database right 2026. This data is licensed under the Open Government Licence v3.0.
Disclaimer: Rightmove.co.uk provides this HM Land Registry data "as is". The burden for fitness of the data relies completely with the user and is provided for informational purposes only. No warranty, express or implied, is given relating to the accuracy of content of the HM Land Registry data and Rightmove does not accept any liability for error or omission. If you have found an error with the data or need further information please contact HM Land Registry.
Permitted Use: Viewers of this Information are granted permission to access this Crown copyright material and to download it onto electronic, magnetic, optical or similar storage media provided that such activities are for private research, study or in-house use only. Any other use of the material requires the formal written permission of Land Registry which can be requested from us, and is subject to an additional licence and associated charge.
Rightmove takes no liability for your use of, or reliance on, Rightmove's Instant Valuation due to the limitations of our tracking tool listed here. Use of this tool is taken entirely at your own risk. All rights reserved.