
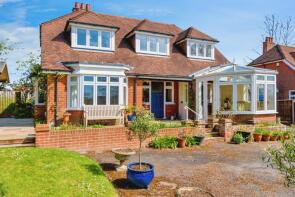
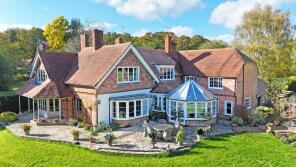
House Prices in SO43
House prices in SO43 have an overall average of £794,797 over the last year.
The majority of properties sold in SO43 during the last year were detached properties, selling for an average price of £1,244,567. Semi-detached properties sold for an average of £424,500, with terraced properties fetching £359,833.
Overall, the historical sold prices in SO43 over the last year were 37% up on the previous year and 11% up on the 2022 peak of £714,682.
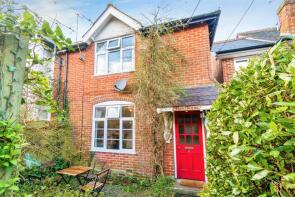
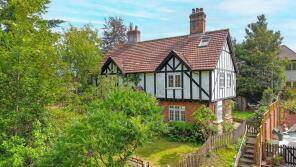
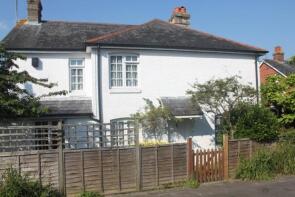
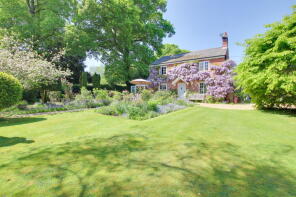
Properties Sold
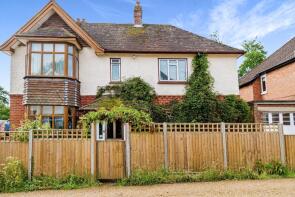
1, Annesley House, Gritnam Road, Lyndhurst SO43 7FD
| Today | See what it's worth now |
| 10 Apr 2026 | £440,000 |
| 21 Aug 2023 | £450,000 |
No other historical records.
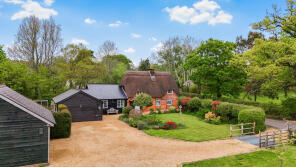
Eyeworth Lodge, Road From Fritham To Eyeworth, Eyeworth, Lyndhurst SO43 7HJ
| Today | See what it's worth now |
| 1 Apr 2026 | £4,000,000 |
| 9 Feb 1998 | £1,300,000 |
No other historical records.
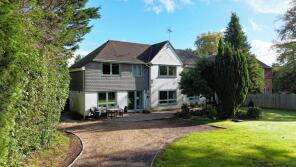
6, Shrubbs Hill Gardens, Lyndhurst SO43 7DL
| Today | See what it's worth now |
| 26 Mar 2026 | £515,000 |
| 13 May 2011 | £376,025 |
No other historical records.
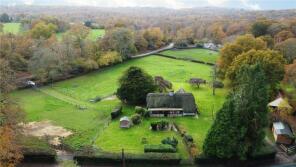
Extensions and planning permission in SO43
See planning approval stats, extension build costs and value added estimates.

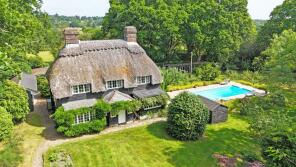
Yew Tree, Lyndhurst Road, Lyndhurst SO43 7FX
| Today | See what it's worth now |
| 20 Mar 2026 | £995,000 |
| 4 Oct 2013 | £725,000 |
Ganders, Goose Green, Lyndhurst SO43 7DH
| Today | See what it's worth now |
| 13 Mar 2026 | £692,500 |
| 22 Mar 2012 | £500,000 |
No other historical records.
Hewers Orchard, Newtown Road, Newtown, Minstead SO43 7GD
| Today | See what it's worth now |
| 11 Mar 2026 | £850,000 |
No other historical records.
4, New Cottages, Pikes Hill, Lyndhurst SO43 7AZ
| Today | See what it's worth now |
| 14 Jan 2026 | £412,000 |
| 11 Feb 2020 | £335,000 |
2, Woodlands Cottages, Pikes Hill, Lyndhurst SO43 7BA
| Today | See what it's worth now |
| 19 Dec 2025 | £396,000 |
| 28 Jun 2001 | £195,000 |
1, The Custards, Lyndhurst SO43 7AP
| Today | See what it's worth now |
| 18 Dec 2025 | £423,000 |
| 10 Sep 1999 | £137,500 |
April Cottage, Queens Parade, Lyndhurst SO43 7AH

| Today | See what it's worth now |
| 17 Dec 2025 | £365,000 |
| 14 Sep 2005 | £240,000 |
6, Castle Malwood Lodge, Lyndhurst Road, Lyndhurst SO43 7HB
| Today | See what it's worth now |
| 28 Nov 2025 | £340,000 |
| 29 Mar 2021 | £345,000 |
Yew Tree Cottage, Pinkney Lane, Bank SO43 7FD
| Today | See what it's worth now |
| 25 Nov 2025 | £1,055,000 |
No other historical records.
Cobwebs, Elcombes Close, Lyndhurst SO43 7DS
| Today | See what it's worth now |
| 19 Nov 2025 | £900,000 |
| 20 Apr 2000 | £249,999 |
No other historical records.
6, The Custards, Lyndhurst SO43 7AP
| Today | See what it's worth now |
| 19 Nov 2025 | £440,000 |
| 21 Dec 2010 | £311,000 |
19, Pemberton Road, Lyndhurst SO43 7AN
| Today | See what it's worth now |
| 14 Nov 2025 | £295,000 |
No other historical records.
Hillside Cottage, Pikes Hill, Lyndhurst SO43 7AY
| Today | See what it's worth now |
| 14 Nov 2025 | £1,075,000 |
| 15 Jan 2004 | £485,000 |
No other historical records.
Staddlestones, Pikes Hill, Lyndhurst SO43 7AY
| Today | See what it's worth now |
| 3 Nov 2025 | £468,000 |
| 31 May 2019 | £445,000 |
1, Haskells Close, Lyndhurst SO43 7EN
| Today | See what it's worth now |
| 31 Oct 2025 | £615,000 |
| 17 Oct 2008 | £370,000 |
8, Northerwood Avenue, Lyndhurst SO43 7DU
| Today | See what it's worth now |
| 30 Oct 2025 | £425,000 |
| 28 May 2008 | £187,000 |
17, Clay Hill, Lyndhurst SO43 7DE
| Today | See what it's worth now |
| 23 Oct 2025 | £507,500 |
| 12 Nov 2012 | £250,000 |
No other historical records.
Hamilton, Chapel Lane, Lyndhurst SO43 7FG
| Today | See what it's worth now |
| 23 Oct 2025 | £725,000 |
No other historical records.
1, Knightwood Lodge, Southampton Road, Lyndhurst SO43 7BU

| Today | See what it's worth now |
| 17 Oct 2025 | £236,000 |
| 17 Apr 2014 | £226,500 |
No other historical records.
Grovewood House, The Grove, Lyndhurst SO43 7GP

| Today | See what it's worth now |
| 16 Oct 2025 | £2,500,000 |
| 28 Feb 2007 | £2,500,000 |
No other historical records.
Source Acknowledgement: © Crown copyright. England and Wales house price data is publicly available information produced by the HM Land Registry.This material was last updated on 9 July 2026. It covers the period from 1 January 1995 to 30 April 2026 and contains property transactions which have been registered during that period. Contains HM Land Registry data © Crown copyright and database right 2026. This data is licensed under the Open Government Licence v3.0.
Disclaimer: Rightmove.co.uk provides this HM Land Registry data "as is". The burden for fitness of the data relies completely with the user and is provided for informational purposes only. No warranty, express or implied, is given relating to the accuracy of content of the HM Land Registry data and Rightmove does not accept any liability for error or omission. If you have found an error with the data or need further information please contact HM Land Registry.
Permitted Use: Viewers of this Information are granted permission to access this Crown copyright material and to download it onto electronic, magnetic, optical or similar storage media provided that such activities are for private research, study or in-house use only. Any other use of the material requires the formal written permission of Land Registry which can be requested from us, and is subject to an additional licence and associated charge.
Rightmove takes no liability for your use of, or reliance on, Rightmove's Instant Valuation due to the limitations of our tracking tool listed here. Use of this tool is taken entirely at your own risk. All rights reserved.