
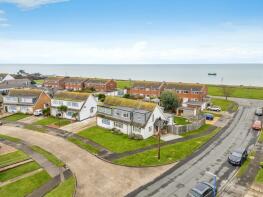
House Prices in Selsey
House prices in Selsey have an overall average of £377,808 over the last year.
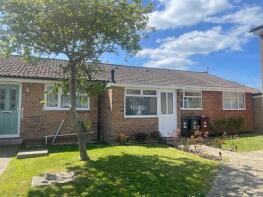
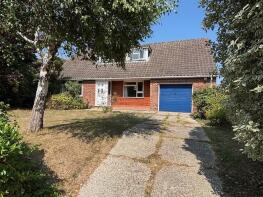
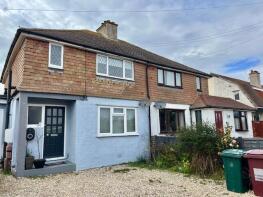
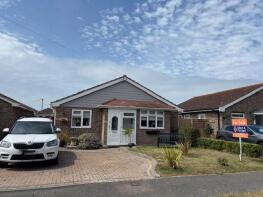
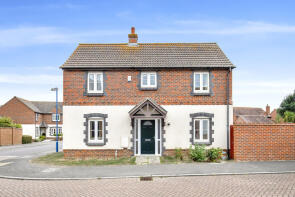
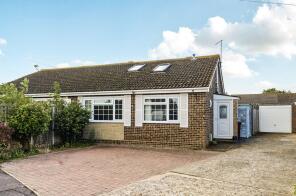
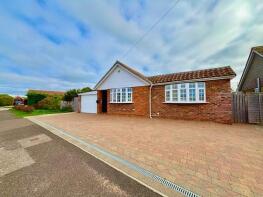
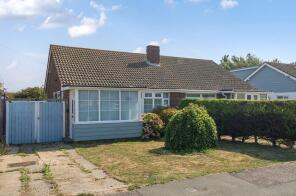
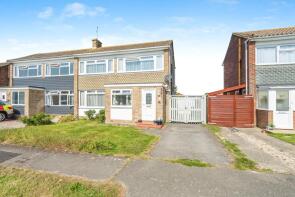
The majority of properties sold in Selsey during the last year were detached properties, selling for an average price of £474,715. Semi-detached properties sold for an average of £326,910, with terraced properties fetching £292,179.
Overall, the historical sold prices in Selsey over the last year were 5% up on the previous year and 2% down on the 2022 peak of £386,699.
Properties Sold
3, Townsend Drive, Selsey PO20 0GA
| Today | See what it's worth now |
| 24 Apr 2026 | £325,000 |
| 20 Dec 2024 | £323,000 |
No other historical records.
2, Brampton Close, Chichester PO20 0PX
| Today | See what it's worth now |
| 8 Apr 2026 | £294,000 |
| 1 Jun 1999 | £85,000 |
8, Broad View, Chichester PO20 0SX
| Today | See what it's worth now |
| 2 Apr 2026 | £215,000 |
| 3 May 2001 | £94,950 |
No other historical records.
6 Fullick Cottage, Albion Road, Chichester PO20 0DH
| Today | See what it's worth now |
| 1 Apr 2026 | £370,000 |
| 11 Dec 2024 | £347,500 |
14, Canadian Crescent, Chichester PO20 0UQ
| Today | See what it's worth now |
| 24 Mar 2026 | £395,000 |
| 17 Feb 2015 | £270,000 |
Fortfore, Ursula Square, Chichester PO20 0HR
| Today | See what it's worth now |
| 18 Mar 2026 | £520,000 |
| 18 Oct 2002 | £289,950 |
96, Gainsborough Drive, Chichester PO20 0HG
| Today | See what it's worth now |
| 16 Mar 2026 | £320,000 |
| 29 Nov 2019 | £255,000 |
22, West Street, Chichester PO20 9AB
| Today | See what it's worth now |
| 10 Mar 2026 | £415,000 |
| 25 Jun 1996 | £95,000 |
No other historical records.
56b, Windsor Road, Chichester PO20 0AU
| Today | See what it's worth now |
| 9 Mar 2026 | £166,500 |
| 6 Feb 2006 | £102,000 |
No other historical records.
79, Drift Road, Chichester PO20 0PN
| Today | See what it's worth now |
| 5 Mar 2026 | £452,500 |
| 24 Aug 2023 | £460,000 |
71, Grafton Road, Chichester PO20 0JB
| Today | See what it's worth now |
| 2 Mar 2026 | £520,000 |
| 14 Dec 2007 | £295,000 |
4 Little Trees, Park Road, Chichester PO20 0PR

| Today | See what it's worth now |
| 27 Feb 2026 | £260,000 |
| 20 Sep 2002 | £176,500 |
28, The Willows, Manor Farm Court, Chichester PO20 0JT
| Today | See what it's worth now |
| 27 Feb 2026 | £175,000 |
| 19 Oct 2012 | £90,000 |
2, Lawrence Close, Chichester PO20 0TN
| Today | See what it's worth now |
| 26 Feb 2026 | £382,000 |
| 6 Jan 2020 | £279,000 |
71, Drift Road, Chichester PO20 0PN
| Today | See what it's worth now |
| 26 Feb 2026 | £365,000 |
| 28 Apr 2022 | £345,000 |
No other historical records.
11, Mountwood Road, Chichester PO20 0PA
| Today | See what it's worth now |
| 25 Feb 2026 | £247,000 |
| 1 Aug 2005 | £107,000 |
No other historical records.
33, Wellington Gardens, Chichester PO20 0RF
| Today | See what it's worth now |
| 20 Feb 2026 | £270,000 |
| 15 May 2003 | £147,950 |
No other historical records.
7, Landseer Drive, Chichester PO20 0EQ
| Today | See what it's worth now |
| 20 Feb 2026 | £355,000 |
| 11 Sep 2013 | £230,000 |
No other historical records.
1, Hubble Close, Chichester PO20 0BQ
| Today | See what it's worth now |
| 19 Feb 2026 | £425,000 |
| 29 Sep 2017 | £350,000 |
No other historical records.
1, Robinson Close, Chichester PO20 0FD
| Today | See what it's worth now |
| 19 Feb 2026 | £352,500 |
| 7 Jun 2007 | £232,500 |
19, Wheatfield Road, Chichester PO20 0NY
| Today | See what it's worth now |
| 12 Feb 2026 | £315,000 |
| 19 Jan 2017 | £260,000 |
36, Fontwell Road, Chichester PO20 0PE
| Today | See what it's worth now |
| 10 Feb 2026 | £450,000 |
| 20 Jul 2018 | £290,000 |
111, Beach Road, Chichester PO20 0SZ
| Today | See what it's worth now |
| 6 Feb 2026 | £265,000 |
| 15 Dec 1998 | £65,500 |
No other historical records.
Source Acknowledgement: © Crown copyright. England and Wales house price data is publicly available information produced by the HM Land Registry.This material was last updated on 9 July 2026. It covers the period from 1 January 1995 to 30 April 2026 and contains property transactions which have been registered during that period. Contains HM Land Registry data © Crown copyright and database right 2026. This data is licensed under the Open Government Licence v3.0.
Disclaimer: Rightmove.co.uk provides this HM Land Registry data "as is". The burden for fitness of the data relies completely with the user and is provided for informational purposes only. No warranty, express or implied, is given relating to the accuracy of content of the HM Land Registry data and Rightmove does not accept any liability for error or omission. If you have found an error with the data or need further information please contact HM Land Registry.
Permitted Use: Viewers of this Information are granted permission to access this Crown copyright material and to download it onto electronic, magnetic, optical or similar storage media provided that such activities are for private research, study or in-house use only. Any other use of the material requires the formal written permission of Land Registry which can be requested from us, and is subject to an additional licence and associated charge.
Rightmove takes no liability for your use of, or reliance on, Rightmove's Instant Valuation due to the limitations of our tracking tool listed here. Use of this tool is taken entirely at your own risk. All rights reserved.