
House Prices in Shadwell
House prices in Shadwell have an overall average of £543,487 over the last year.
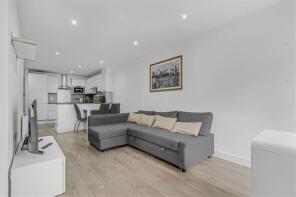
The majority of properties sold in Shadwell during the last year were flats, selling for an average price of £539,449. Terraced properties sold for an average of £652,500.
Overall, the historical sold prices in Shadwell over the last year were 1% up on the previous year and 36% down on the 2019 peak of £851,000.
Properties Sold
Flat 60, 1, Prescot Street, London E1 8RJ
| Today | See what it's worth now |
| 14 Apr 2026 | £340,000 |
| 21 Jul 2003 | £185,000 |
Flat 1, Fisher House, Cable Street, London E1 0AW
| Today | See what it's worth now |
| 10 Apr 2026 | £400,000 |
| 17 Mar 2006 | £190,000 |
No other historical records.
6, Hawksmoor Mews, London E1 0DG

| Today | See what it's worth now |
| 27 Mar 2026 | £605,000 |
No other historical records.
Flat 2, 26, Cannon Street Road, London E1 0BH
| Today | See what it's worth now |
| 13 Mar 2026 | £455,000 |
| 1 Mar 2004 | £180,000 |
Flat 508, 16 Wilson Tower, Christian Street, London E1 1AW

| Today | See what it's worth now |
| 9 Mar 2026 | £425,000 |
| 12 Sep 2014 | £499,888 |
Flat 25, 56 Hannah Building, Watney Street, London E1 2QU
| Today | See what it's worth now |
| 4 Mar 2026 | £270,000 |
| 27 Nov 2014 | £148,500 |
No other historical records.
Flat 5, 3 Tate Apartments, Sly Street, London E1 2BE
| Today | See what it's worth now |
| 26 Feb 2026 | £400,000 |
| 3 Nov 2017 | £430,000 |
Flat 8, 9, Boyd Street, London E1 1NH

| Today | See what it's worth now |
| 13 Feb 2026 | £595,000 |
| 6 Jul 2015 | £835,001 |
20, Conant Mews, London E1 8RZ
| Today | See what it's worth now |
| 11 Feb 2026 | £425,000 |
| 20 May 2015 | £375,000 |
Flat 606, 16 Wilson Tower, Christian Street, London E1 1AW

| Today | See what it's worth now |
| 30 Jan 2026 | £265,000 |
| 20 Mar 2015 | £320,000 |
Flat 2, 57, Alie Street, London E1 8EB

| Today | See what it's worth now |
| 28 Jan 2026 | £430,000 |
| 11 Aug 2006 | £248,000 |
Apartment 1002, 84 Meranti House, Alie Street, London E1 8QD

| Today | See what it's worth now |
| 22 Jan 2026 | £1,145,000 |
| 18 Sep 2017 | £1,641,000 |
No other historical records.
478, Cable Street, London E1W 3DR
| Today | See what it's worth now |
| 7 Jan 2026 | £410,000 |
| 27 Apr 2007 | £189,000 |
No other historical records.
Apartment 1101, 1 Kingwood House, Chaucer Gardens, London E1 8QF
| Today | See what it's worth now |
| 5 Jan 2026 | £870,000 |
| 4 Jun 2018 | £1,225,000 |
No other historical records.
Flat 29, 1, Prescot Street, London E1 8RJ

| Today | See what it's worth now |
| 19 Dec 2025 | £405,000 |
| 19 Dec 2014 | £465,000 |
Flat 37, 1, Prescot Street, London E1 8RJ

| Today | See what it's worth now |
| 17 Dec 2025 | £765,000 |
| 11 Jul 2018 | £780,000 |
Flat 19, 129, Back Church Lane, London E1 1LS

| Today | See what it's worth now |
| 11 Dec 2025 | £550,000 |
| 4 Jan 2019 | £540,000 |
Flat 8, 3 Wheelers House, Ratcliffe Cross Street, London E1 0FD

| Today | See what it's worth now |
| 3 Dec 2025 | £352,000 |
| 1 Dec 2023 | £143,500 |
No other historical records.
Flat 1004, 16 Wilson Tower, Christian Street, London E1 1AW

| Today | See what it's worth now |
| 28 Nov 2025 | £486,750 |
| 22 Jun 2012 | £330,078 |
No other historical records.
Flat 15, 1, Prescot Street, London E1 8RJ

| Today | See what it's worth now |
| 28 Nov 2025 | £389,500 |
| 28 Apr 2017 | £475,000 |
Flat 36, Foley House, Tarling Street, London E1 0AZ

| Today | See what it's worth now |
| 27 Nov 2025 | £272,500 |
| 12 Mar 2014 | £230,000 |
No other historical records.
Flat 87, 1, Prescot Street, London E1 8RL

| Today | See what it's worth now |
| 25 Nov 2025 | £350,000 |
| 30 Nov 2007 | £349,950 |
Flat 54, 2 Kelday Heights, Spencer Way, London E1 2PW

| Today | See what it's worth now |
| 13 Nov 2025 | £540,000 |
| 2 Feb 2016 | £494,000 |

Source Acknowledgement: © Crown copyright. England and Wales house price data is publicly available information produced by the HM Land Registry.This material was last updated on 9 July 2026. It covers the period from 1 January 1995 to 30 April 2026 and contains property transactions which have been registered during that period. Contains HM Land Registry data © Crown copyright and database right 2026. This data is licensed under the Open Government Licence v3.0.
Disclaimer: Rightmove.co.uk provides this HM Land Registry data "as is". The burden for fitness of the data relies completely with the user and is provided for informational purposes only. No warranty, express or implied, is given relating to the accuracy of content of the HM Land Registry data and Rightmove does not accept any liability for error or omission. If you have found an error with the data or need further information please contact HM Land Registry.
Permitted Use: Viewers of this Information are granted permission to access this Crown copyright material and to download it onto electronic, magnetic, optical or similar storage media provided that such activities are for private research, study or in-house use only. Any other use of the material requires the formal written permission of Land Registry which can be requested from us, and is subject to an additional licence and associated charge.
Rightmove takes no liability for your use of, or reliance on, Rightmove's Instant Valuation due to the limitations of our tracking tool listed here. Use of this tool is taken entirely at your own risk. All rights reserved.