
House Prices in Shaldon
House prices in Shaldon have an overall average of £525,004 over the last year.
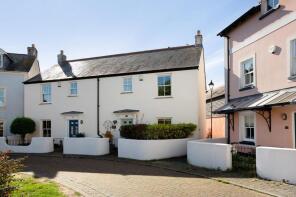
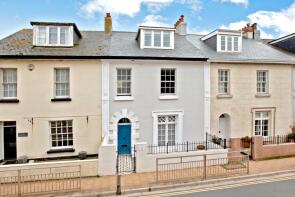
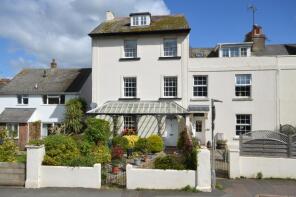
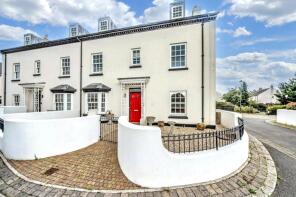
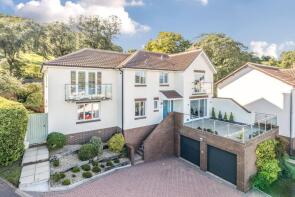
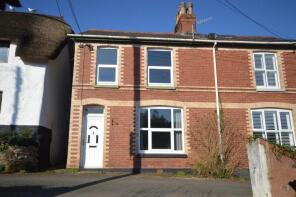
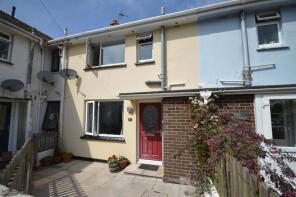
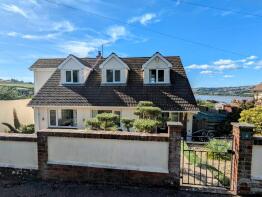
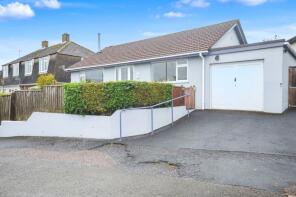
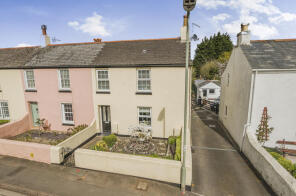
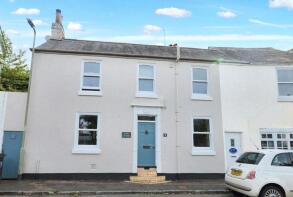
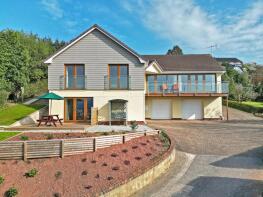
The majority of properties sold in Shaldon during the last year were detached properties, selling for an average price of £660,867. Terraced properties sold for an average of £379,015, with flats fetching £258,750.
Overall, the historical sold prices in Shaldon over the last year were 4% up on the previous year and 18% down on the 2022 peak of £641,409.
Properties Sold
40, Shoreside, Teignmouth TQ14 0BP
| Today | See what it's worth now |
| 24 Mar 2026 | £460,000 |
| 6 Jun 2019 | £425,000 |
8, Bridge Road, Teignmouth TQ14 0DD
| Today | See what it's worth now |
| 27 Feb 2026 | £485,000 |
| 27 Oct 2021 | £480,000 |
7, Oak Tree Grove, Teignmouth TQ14 0BU
| Today | See what it's worth now |
| 17 Feb 2026 | £650,000 |
| 27 Mar 2001 | £215,000 |
No other historical records.
Flat 2, 10, Ringmore Road, Teignmouth TQ14 0AA
| Today | See what it's worth now |
| 13 Feb 2026 | £180,000 |
| 3 Dec 2014 | £145,000 |
No other historical records.
2, Shoreside, Teignmouth TQ14 0BP
| Today | See what it's worth now |
| 6 Feb 2026 | £495,000 |
| 18 Oct 2024 | £475,000 |
1, Oak Tree Grove, Teignmouth TQ14 0BU
| Today | See what it's worth now |
| 30 Jan 2026 | £825,000 |
| 22 Mar 2017 | £650,000 |
No other historical records.
23, Dunmore Court, Dunmore Drive, Teignmouth TQ14 0BS
| Today | See what it's worth now |
| 9 Jan 2026 | £290,000 |
| 11 Apr 2012 | £238,000 |
Lothair, Higher Ringmore Road, Shaldon TQ14 0HG
| Today | See what it's worth now |
| 8 Jan 2026 | £428,000 |
No other historical records.
44, Shoreside, Teignmouth TQ14 0BP
| Today | See what it's worth now |
| 15 Dec 2025 | £520,000 |
| 26 May 2005 | £350,000 |
No other historical records.
7, Clifford Close, Teignmouth TQ14 0AD
| Today | See what it's worth now |
| 21 Nov 2025 | £293,500 |
| 8 Jul 2020 | £295,000 |
4, Ham Lane, Teignmouth TQ14 0HW
| Today | See what it's worth now |
| 21 Nov 2025 | £845,000 |
| 30 Jun 2021 | £775,000 |
8a, Palk Close, Teignmouth TQ14 0AH
| Today | See what it's worth now |
| 17 Nov 2025 | £415,000 |
| 2 Sep 2013 | £310,000 |
20, Ferrymans Reach, Marine Parade, Teignmouth TQ14 0DP

| Today | See what it's worth now |
| 12 Nov 2025 | £375,000 |
| 3 Dec 2014 | £135,000 |
44, Ringmore Road, Teignmouth TQ14 0AB
| Today | See what it's worth now |
| 7 Nov 2025 | £425,000 |
| 24 Jun 2014 | £250,000 |
Darwin, Coombe Road, Teignmouth TQ14 0EX
| Today | See what it's worth now |
| 29 Oct 2025 | £2,100,000 |
No other historical records.
94, Ringmore Road, Teignmouth TQ14 0ET
| Today | See what it's worth now |
| 17 Oct 2025 | £350,000 |
| 3 Dec 2020 | £335,000 |
18, Ferrymans Reach, Marine Parade, Teignmouth TQ14 0DP
| Today | See what it's worth now |
| 15 Oct 2025 | £190,000 |
| 16 Apr 2004 | £189,950 |
Wyche Cottage, Dagmar Street, Teignmouth TQ14 0EB
| Today | See what it's worth now |
| 3 Oct 2025 | £365,000 |
| 12 Dec 1996 | £135,000 |
8, Crown Square, Teignmouth TQ14 0DS
| Today | See what it's worth now |
| 30 Sep 2025 | £237,500 |
| 15 Nov 2002 | £142,500 |
5, Ringmore Road, Teignmouth TQ14 0AG
| Today | See what it's worth now |
| 26 Sep 2025 | £285,000 |
| 13 Mar 2020 | £264,445 |
Highover Cottage, Higher Ringmore Road, Shaldon TQ14 0EZ
| Today | See what it's worth now |
| 17 Sep 2025 | £404,500 |
No other historical records.
The Mount, Brook Lane, Shaldon TQ14 0HL
| Today | See what it's worth now |
| 17 Sep 2025 | £995,000 |
No other historical records.
31, Shoreside, Teignmouth TQ14 0BP

| Today | See what it's worth now |
| 22 Aug 2025 | £455,000 |
| 18 Dec 2006 | £355,000 |
Source Acknowledgement: © Crown copyright. England and Wales house price data is publicly available information produced by the HM Land Registry.This material was last updated on 9 July 2026. It covers the period from 1 January 1995 to 30 April 2026 and contains property transactions which have been registered during that period. Contains HM Land Registry data © Crown copyright and database right 2026. This data is licensed under the Open Government Licence v3.0.
Disclaimer: Rightmove.co.uk provides this HM Land Registry data "as is". The burden for fitness of the data relies completely with the user and is provided for informational purposes only. No warranty, express or implied, is given relating to the accuracy of content of the HM Land Registry data and Rightmove does not accept any liability for error or omission. If you have found an error with the data or need further information please contact HM Land Registry.
Permitted Use: Viewers of this Information are granted permission to access this Crown copyright material and to download it onto electronic, magnetic, optical or similar storage media provided that such activities are for private research, study or in-house use only. Any other use of the material requires the formal written permission of Land Registry which can be requested from us, and is subject to an additional licence and associated charge.
Rightmove takes no liability for your use of, or reliance on, Rightmove's Instant Valuation due to the limitations of our tracking tool listed here. Use of this tool is taken entirely at your own risk. All rights reserved.