
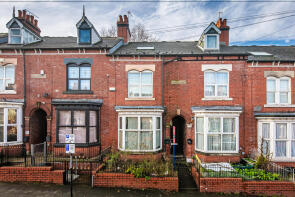
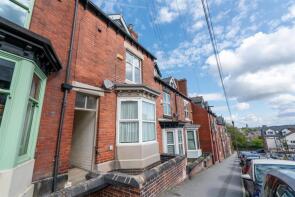
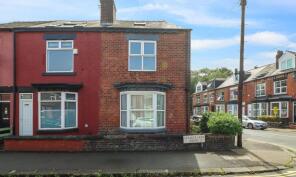
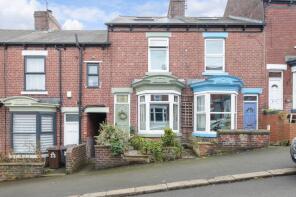
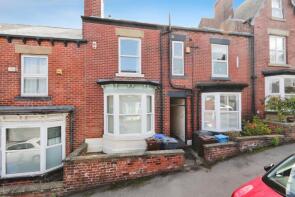
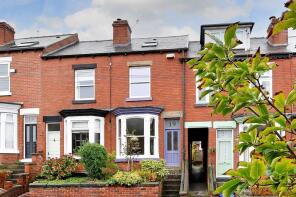
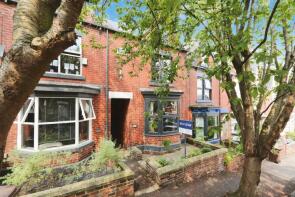
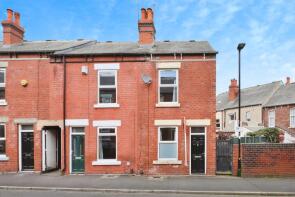
House Prices in Sharrow Vale
House prices in Sharrow Vale have an overall average of £338,556 over the last year.
The majority of properties sold in Sharrow Vale during the last year were terraced properties, selling for an average price of £310,211. Semi-detached properties sold for an average of £516,472, with flats fetching £177,809.
Overall, the historical sold prices in Sharrow Vale over the last year were 15% up on the previous year and 4% up on the 2022 peak of £325,931.
Properties Sold
90, Club Garden Road, Sheffield S11 8BW
| Today | See what it's worth now |
| 15 Apr 2026 | £105,000 |
No other historical records.
185, Cemetery Road, Sheffield S11 8FQ
| Today | See what it's worth now |
| 2 Apr 2026 | £377,000 |
| 18 Jul 2019 | £240,000 |
46, Pinner Road, Sheffield S11 8UH
| Today | See what it's worth now |
| 1 Apr 2026 | £257,500 |
| 1 Oct 1998 | £63,950 |
No other historical records.
109, Neill Road, Sheffield S11 8QJ
| Today | See what it's worth now |
| 27 Mar 2026 | £225,000 |
| 3 Nov 2006 | £185,000 |
32, Hunter House Road, Sheffield S11 8TW
| Today | See what it's worth now |
| 17 Mar 2026 | £326,500 |
| 8 May 1998 | £63,500 |
73, Cowlishaw Road, Sheffield S11 8XE

| Today | See what it's worth now |
| 12 Mar 2026 | £396,000 |
| 2 Dec 2005 | £160,000 |
No other historical records.
61, Penrhyn Road, Sheffield S11 8UL
| Today | See what it's worth now |
| 9 Mar 2026 | £335,000 |
| 6 Oct 2000 | £95,000 |
No other historical records.
35, Rosedale Road, Sheffield S11 8NW
| Today | See what it's worth now |
| 6 Mar 2026 | £217,000 |
| 25 May 2018 | £235,000 |
25, Hunter Hill Road, Sheffield S11 8UD
| Today | See what it's worth now |
| 5 Mar 2026 | £252,200 |
| 18 Dec 2009 | £161,000 |
61, Hunter House Road, Sheffield S11 8TU
| Today | See what it's worth now |
| 5 Mar 2026 | £347,500 |
| 27 Nov 2015 | £242,000 |
9, Meadow Terrace, Sheffield S11 8QN

| Today | See what it's worth now |
| 2 Mar 2026 | £281,011 |
| 9 Dec 2011 | £122,000 |
No other historical records.
61, Hunter Hill Road, Sheffield S11 8UD
| Today | See what it's worth now |
| 27 Feb 2026 | £295,000 |
| 10 Oct 2003 | £127,500 |
No other historical records.
791, Ecclesall Road, Sheffield S11 8TH
| Today | See what it's worth now |
| 26 Feb 2026 | £250,000 |
| 20 Dec 1999 | £49,000 |
No other historical records.
7, Hardwick Crescent, Sheffield S11 8WB
| Today | See what it's worth now |
| 19 Feb 2026 | £575,000 |
No other historical records.
54, Everton Road, Sheffield S11 8RY
| Today | See what it's worth now |
| 19 Feb 2026 | £379,000 |
| 9 Sep 2013 | £222,000 |
19, Wayland Road, Sheffield S11 8YD
| Today | See what it's worth now |
| 16 Feb 2026 | £350,000 |
| 4 Jun 2021 | £254,000 |
No other historical records.
323, Sharrow Lane, Sheffield S11 8AP

| Today | See what it's worth now |
| 9 Feb 2026 | £560,000 |
| 4 Jun 2001 | £133,250 |
No other historical records.
Flat 7, 343 Thornsett Court, Sharrow Lane, Sheffield S11 8AQ
| Today | See what it's worth now |
| 6 Feb 2026 | £125,000 |
| 6 Sep 1996 | £32,000 |
No other historical records.
Flat 1, 100, Psalter Lane, Sheffield S11 8YQ

| Today | See what it's worth now |
| 5 Feb 2026 | £177,000 |
| 20 Jul 2018 | £158,000 |
180, Hunter House Road, Sheffield S11 8TZ

| Today | See what it's worth now |
| 3 Feb 2026 | £436,000 |
| 30 Mar 2021 | £340,000 |
9, Ashford Road, Sheffield S11 8XZ

| Today | See what it's worth now |
| 30 Jan 2026 | £243,000 |
| 18 Aug 2023 | £209,000 |
No other historical records.
98, Wayland Road, Sheffield S11 8YE
| Today | See what it's worth now |
| 30 Jan 2026 | £378,000 |
| 8 Jan 1999 | £70,000 |
No other historical records.
31, Hobart Street, Sheffield S11 8DB
| Today | See what it's worth now |
| 23 Jan 2026 | £125,000 |
| 1 Sep 2005 | £70,000 |
Source Acknowledgement: © Crown copyright. England and Wales house price data is publicly available information produced by the HM Land Registry.This material was last updated on 9 July 2026. It covers the period from 1 January 1995 to 30 April 2026 and contains property transactions which have been registered during that period. Contains HM Land Registry data © Crown copyright and database right 2026. This data is licensed under the Open Government Licence v3.0.
Disclaimer: Rightmove.co.uk provides this HM Land Registry data "as is". The burden for fitness of the data relies completely with the user and is provided for informational purposes only. No warranty, express or implied, is given relating to the accuracy of content of the HM Land Registry data and Rightmove does not accept any liability for error or omission. If you have found an error with the data or need further information please contact HM Land Registry.
Permitted Use: Viewers of this Information are granted permission to access this Crown copyright material and to download it onto electronic, magnetic, optical or similar storage media provided that such activities are for private research, study or in-house use only. Any other use of the material requires the formal written permission of Land Registry which can be requested from us, and is subject to an additional licence and associated charge.
Rightmove takes no liability for your use of, or reliance on, Rightmove's Instant Valuation due to the limitations of our tracking tool listed here. Use of this tool is taken entirely at your own risk. All rights reserved.