
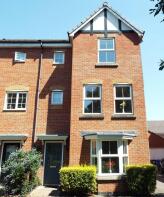
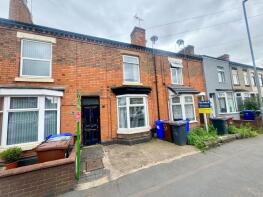
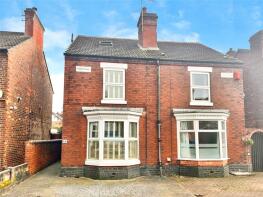
House Prices in Shobnall
House prices in Shobnall have an overall average of £159,399 over the last year.
The majority of properties sold in Shobnall during the last year were terraced properties, selling for an average price of £144,303. Semi-detached properties sold for an average of £181,750, with flats fetching £100,611.
Overall, the historical sold prices in Shobnall over the last year were 3% up on the previous year and similar to the 2022 peak of £158,983.
Properties Sold
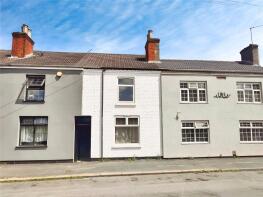
127, Thornley Street, Burton-on-trent DE14 2QP
| Today | See what it's worth now |
| 13 Oct 2025 | £95,500 |
| 27 Jan 1995 | £22,000 |
No other historical records.
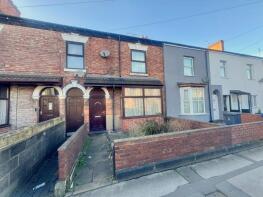
7, Temple Close, Burton-on-trent DE14 2AG


| Today | See what it's worth now |
| 6 Oct 2025 | £229,950 |
| 23 Jun 1995 | £54,000 |
No other historical records.
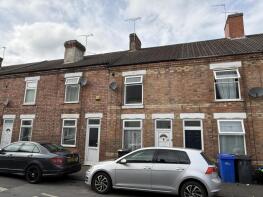
124, Derby Street, Burton Upon Trent DE14 2LF
| Today | See what it's worth now |
| 12 Sep 2025 | £159,000 |
No other historical records.
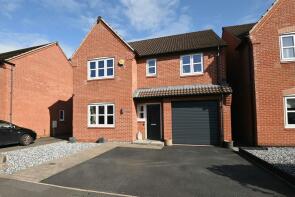
39, Blakeholme Court, Burton-on-trent DE14 2QJ

| Today | See what it's worth now |
| 12 Sep 2025 | £170,000 |
| 30 Mar 2016 | £120,000 |
97, Eton Road, Burton-on-trent DE14 2SN

| Today | See what it's worth now |
| 11 Sep 2025 | £143,000 |
| 16 Feb 2022 | £135,000 |
83, Goodman Street, Burton-on-trent DE14 2RE
| Today | See what it's worth now |
| 5 Sep 2025 | £125,000 |
| 28 Jan 2022 | £110,000 |
51, Masefield Crescent, Burton-on-trent DE14 2SQ

| Today | See what it's worth now |
| 29 Aug 2025 | £73,000 |
| 24 Oct 2014 | £59,000 |
No other historical records.
53, Byrkley Street, Burton-on-trent DE14 2EL

| Today | See what it's worth now |
| 22 Aug 2025 | £130,000 |
| 2 Dec 2024 | £65,000 |
45, Bridgewater Road, Burton-on-trent DE14 2GD
| Today | See what it's worth now |
| 15 Aug 2025 | £318,000 |
| 5 Oct 2015 | £245,995 |
No other historical records.
55, The Carousels, Burton-on-trent DE14 2QG
| Today | See what it's worth now |
| 12 Aug 2025 | £140,000 |
| 7 Feb 2022 | £112,000 |
12, Pipers Way, Burton-on-trent DE14 2GU
| Today | See what it's worth now |
| 11 Aug 2025 | £160,000 |
| 27 Oct 2008 | £109,950 |
No other historical records.
56, Victoria Crescent, Burton-on-trent DE14 2QD
| Today | See what it's worth now |
| 8 Aug 2025 | £120,000 |
| 1 Feb 2007 | £56,000 |
6, St Pauls Street West, Burton-on-trent DE14 2EW
| Today | See what it's worth now |
| 8 Aug 2025 | £115,000 |
| 17 Apr 2015 | £70,000 |
No other historical records.
31, Clough Drive, Burton-on-trent DE14 2DL
| Today | See what it's worth now |
| 7 Aug 2025 | £270,000 |
| 31 Jul 2015 | £181,000 |
29, Shobnall Street, Burton Upon Trent DE14 2HE
| Today | See what it's worth now |
| 4 Aug 2025 | £150,000 |
No other historical records.
97, Waterloo Street, Burton-on-trent DE14 2ND
| Today | See what it's worth now |
| 31 Jul 2025 | £60,000 |
| 11 Jan 2008 | £76,000 |
No other historical records.
65, Outwoods Street, Burton-on-trent DE14 2PL
| Today | See what it's worth now |
| 30 Jul 2025 | £272,500 |
| 1 Jun 2022 | £284,500 |
117, Shakespeare Road, Burton-on-trent DE14 2RU
| Today | See what it's worth now |
| 23 Jul 2025 | £98,000 |
| 1 Nov 2022 | £90,000 |
No other historical records.
103, Sydney Street, Burton Upon Trent DE14 2QY

| Today | See what it's worth now |
| 22 Jul 2025 | £220,000 |
No other historical records.
52, Waverley Lane, Burton-on-trent DE14 2HG
| Today | See what it's worth now |
| 21 Jul 2025 | £190,000 |
| 24 Aug 2001 | £64,500 |
31, Outwoods Street, Burton-on-trent DE14 2PL
| Today | See what it's worth now |
| 14 Jul 2025 | £240,000 |
| 29 Apr 2016 | £125,000 |
No other historical records.
65, Waverley Lane, Burton-on-trent DE14 2HG
| Today | See what it's worth now |
| 14 Jul 2025 | £170,000 |
| 2 Feb 2021 | £148,000 |
No other historical records.
51, Victoria Street, Burton Upon Trent DE14 2LS
| Today | See what it's worth now |
| 11 Jul 2025 | £101,250 |
No other historical records.
3, Vernon Terrace, Victoria Street, Burton-on-trent DE14 2LT
| Today | See what it's worth now |
| 11 Jul 2025 | £90,000 |
| 11 Aug 2008 | £62,000 |
No other historical records.
23, Hendeley Court, Burton-on-trent DE14 2BH
| Today | See what it's worth now |
| 10 Jul 2025 | £86,500 |
| 31 May 2006 | £109,995 |
No other historical records.
Get ready with a Mortgage in Principle
- Personalised result in just 20 minutes
- Find out how much you can borrow
- Get viewings faster with agents
- No impact on your credit score
What's your property worth?
Source Acknowledgement: © Crown copyright. England and Wales house price data is publicly available information produced by the HM Land Registry.This material was last updated on 2 December 2025. It covers the period from 1 January 1995 to 31 October 2025 and contains property transactions which have been registered during that period. Contains HM Land Registry data © Crown copyright and database right 2025. This data is licensed under the Open Government Licence v3.0.
Disclaimer: Rightmove.co.uk provides this HM Land Registry data "as is". The burden for fitness of the data relies completely with the user and is provided for informational purposes only. No warranty, express or implied, is given relating to the accuracy of content of the HM Land Registry data and Rightmove does not accept any liability for error or omission. If you have found an error with the data or need further information please contact HM Land Registry.
Permitted Use: Viewers of this Information are granted permission to access this Crown copyright material and to download it onto electronic, magnetic, optical or similar storage media provided that such activities are for private research, study or in-house use only. Any other use of the material requires the formal written permission of Land Registry which can be requested from us, and is subject to an additional licence and associated charge.
Map data ©OpenStreetMap contributors.
Rightmove takes no liability for your use of, or reliance on, Rightmove's Instant Valuation due to the limitations of our tracking tool listed here. Use of this tool is taken entirely at your own risk. All rights reserved.