
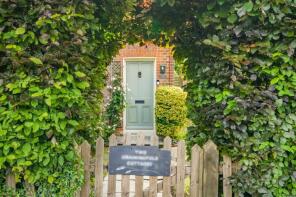
House Prices in Slinfold
House prices in Slinfold have an overall average of £656,222 over the last year.
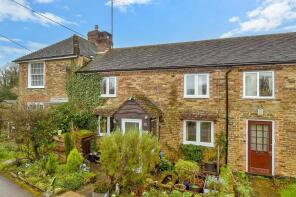
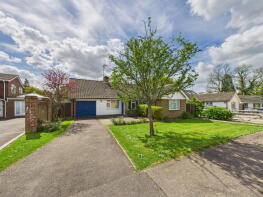
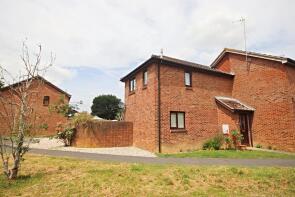
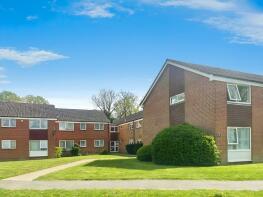
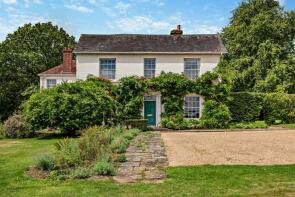
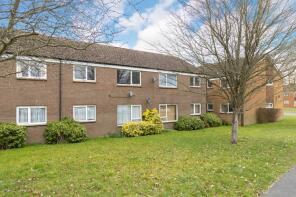
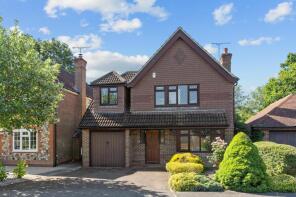
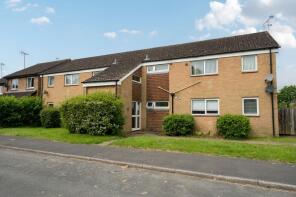
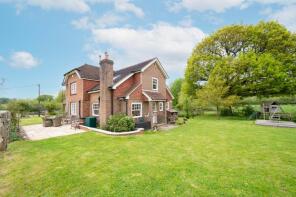
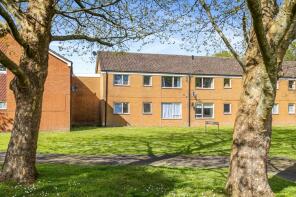
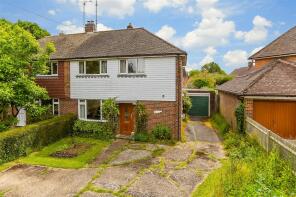
The majority of properties sold in Slinfold during the last year were detached properties, selling for an average price of £823,600. Semi-detached properties sold for an average of £616,500, with terraced properties fetching £350,000.
Overall, the historical sold prices in Slinfold over the last year were 17% down on the previous year and 26% down on the 2022 peak of £884,846.
Properties Sold
2, Theale Cottages, Lyons Road, Horsham RH13 0QT
| Today | See what it's worth now |
| 28 Nov 2025 | £350,000 |
| 25 Sep 2019 | £325,000 |
3, West Way, Horsham RH13 0SB
| Today | See what it's worth now |
| 13 Oct 2025 | £625,000 |
| 21 Apr 2016 | £535,000 |
52, Streetfield Road, Horsham RH13 0SE
| Today | See what it's worth now |
| 13 Oct 2025 | £308,000 |
| 26 Jul 2002 | £116,500 |
The Potters, Hayes Lane, Horsham RH13 0SQ

| Today | See what it's worth now |
| 2 Sep 2025 | £1,050,000 |
| 31 Jan 2020 | £743,000 |
No other historical records.
42, The Grattons, Horsham RH13 0QL
| Today | See what it's worth now |
| 29 Aug 2025 | £205,000 |
| 21 Aug 2014 | £138,000 |
Grainingfold, Horsham Road, Five Oaks RH14 9AT
| Today | See what it's worth now |
| 14 Aug 2025 | £1,600,000 |
| 20 Sep 2001 | £460,000 |
No other historical records.
Crosby Farm Cottage, Lyons Road, Slinfold RH13 0RX

| Today | See what it's worth now |
| 4 Aug 2025 | £218,000 |
No other historical records.
Owl Farm, Lyons Road, Horsham RH13 0QT
| Today | See what it's worth now |
| 27 Jun 2025 | £925,000 |
| 8 Jul 2013 | £410,000 |
No other historical records.
Robins, Furze View, Horsham RH13 0RH
| Today | See what it's worth now |
| 10 Jun 2025 | £625,000 |
| 5 Jun 1997 | £171,000 |
3, The Grattons, Horsham RH13 0QL
| Today | See what it's worth now |
| 31 Mar 2025 | £195,000 |
| 1 May 2014 | £124,500 |
Pinkhurst, Pinkhurst Lane, Slinfold RH13 0QR
| Today | See what it's worth now |
| 21 Mar 2025 | £1,265,000 |
No other historical records.
2, Churchyard Cottages, Clapgate Lane, Slinfold RH13 0QU
| Today | See what it's worth now |
| 17 Mar 2025 | £610,000 |
| 28 Nov 2003 | £415,000 |
No other historical records.
1, Hayes Cottages, Horsham Road, Five Oaks RH14 9AR
| Today | See what it's worth now |
| 28 Feb 2025 | £310,000 |
No other historical records.
25, Six Acres, Slinfold RH13 0TH

| Today | See what it's worth now |
| 26 Feb 2025 | £202,500 |
No other historical records.
Little Park, Park Road, Horsham RH13 0SD

| Today | See what it's worth now |
| 25 Feb 2025 | £790,000 |
| 2 Sep 2005 | £455,000 |
No other historical records.
5, West Way, Horsham RH13 0SB

| Today | See what it's worth now |
| 21 Feb 2025 | £730,000 |
| 21 May 2014 | £425,000 |
South Lodge, Clapgate Lane, Horsham RH13 0QU
| Today | See what it's worth now |
| 10 Jan 2025 | £1,010,000 |
| 26 Apr 2019 | £690,000 |
2, Grainingfold Cottages, Stane Street, Billingshurst RH14 9AG
| Today | See what it's worth now |
| 18 Dec 2024 | £480,000 |
| 17 Aug 2022 | £465,000 |
9, Mitchell Gardens, Horsham RH13 0TY
| Today | See what it's worth now |
| 16 Dec 2024 | £655,000 |
| 28 Feb 1995 | £162,000 |
No other historical records.
42, Streetfield Road, Horsham RH13 0SE
| Today | See what it's worth now |
| 3 Dec 2024 | £171,500 |
| 28 May 2004 | £132,000 |
No other historical records.
Lane End, Bashurst Hill, Horsham RH13 0PA
| Today | See what it's worth now |
| 31 Oct 2024 | £1,500,000 |
| 12 May 2009 | £800,000 |
Middle Barn Cottage, Lyons Road, Horsham RH13 0QT
| Today | See what it's worth now |
| 14 Oct 2024 | £1,067,500 |
| 25 Nov 2020 | £930,000 |
43, The Grattons, Slinfold RH13 0QL
| Today | See what it's worth now |
| 10 Oct 2024 | £195,000 |
No other historical records.
3a, Gatefield Cottages, Hayes Lane, Horsham RH13 0SS

| Today | See what it's worth now |
| 4 Oct 2024 | £390,000 |
| 23 Aug 2024 | £325,000 |
Arundale, Hayes Lane, Slinfold RH13 0SA
| Today | See what it's worth now |
| 2 Oct 2024 | £451,000 |
No other historical records.
Source Acknowledgement: © Crown copyright. England and Wales house price data is publicly available information produced by the HM Land Registry.This material was last updated on 4 February 2026. It covers the period from 1 January 1995 to 24 December 2025 and contains property transactions which have been registered during that period. Contains HM Land Registry data © Crown copyright and database right 2026. This data is licensed under the Open Government Licence v3.0.
Disclaimer: Rightmove.co.uk provides this HM Land Registry data "as is". The burden for fitness of the data relies completely with the user and is provided for informational purposes only. No warranty, express or implied, is given relating to the accuracy of content of the HM Land Registry data and Rightmove does not accept any liability for error or omission. If you have found an error with the data or need further information please contact HM Land Registry.
Permitted Use: Viewers of this Information are granted permission to access this Crown copyright material and to download it onto electronic, magnetic, optical or similar storage media provided that such activities are for private research, study or in-house use only. Any other use of the material requires the formal written permission of Land Registry which can be requested from us, and is subject to an additional licence and associated charge.
Map data ©OpenStreetMap contributors.
Rightmove takes no liability for your use of, or reliance on, Rightmove's Instant Valuation due to the limitations of our tracking tool listed here. Use of this tool is taken entirely at your own risk. All rights reserved.