
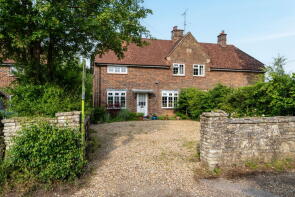
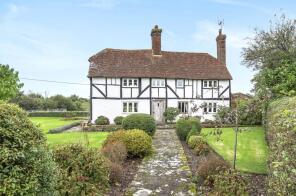
House Prices in Rudgwick
House prices in Rudgwick have an overall average of £943,688 over the last year.
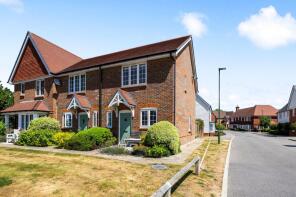
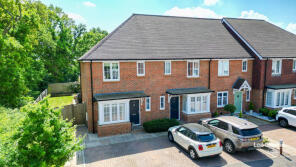
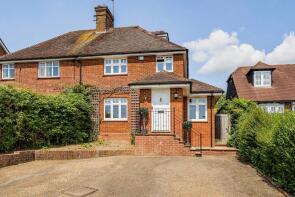
The majority of properties sold in Rudgwick during the last year were detached properties, selling for an average price of £1,377,500. Semi-detached properties sold for an average of £530,833, with terraced properties fetching £447,000.
Overall, the historical sold prices in Rudgwick over the last year were 22% up on the previous year and 28% up on the 2023 peak of £736,543.
Properties Sold
10, Windacres Farm Lane, Horsham RH12 3XQ

| Today | See what it's worth now |
| 27 Mar 2026 | £635,000 |
| 13 Apr 2021 | £619,950 |
No other historical records.
7, Mill Cottages, Naldretts Lane, Horsham RH12 3JQ
| Today | See what it's worth now |
| 16 Feb 2026 | £610,000 |
| 26 Jul 1996 | £145,200 |
No other historical records.
5, Windacres Farm Lane, Horsham RH12 3XQ
| Today | See what it's worth now |
| 27 Jan 2026 | £394,000 |
| 16 Oct 2020 | £359,950 |
No other historical records.
Twyners, Haven Road, Rudgwick RH12 3JG
| Today | See what it's worth now |
| 13 Jan 2026 | £445,000 |
No other historical records.
30, Windacres Farm Lane, Horsham RH12 3XQ
| Today | See what it's worth now |
| 28 Nov 2025 | £500,000 |
| 9 Nov 2020 | £445,000 |
No other historical records.
Tamburlain, Church Street, Horsham RH12 3ET
| Today | See what it's worth now |
| 6 Oct 2025 | £580,000 |
| 15 Jan 2010 | £425,000 |
No other historical records.
8, Thurne Way, Rudgwick RH12 3ER
| Today | See what it's worth now |
| 3 Oct 2025 | £400,000 |
No other historical records.
Gallops Cottage, Morgans Green, The Haven, Billingshurst RH14 9BJ
| Today | See what it's worth now |
| 24 Sep 2025 | £715,000 |
| 27 May 2015 | £320,000 |
No other historical records.
Gravel Pits, Tismans Common, Horsham RH12 3DT
| Today | See what it's worth now |
| 23 Sep 2025 | £3,150,000 |
| 3 Nov 2008 | £1,350,000 |
No other historical records.
Woodside, Hillhouse Lane, Horsham RH12 3BD
| Today | See what it's worth now |
| 16 Sep 2025 | £1,315,000 |
| 7 Sep 2006 | £715,000 |
No other historical records.
Ivy Cottage, The Haven, Billingshurst RH14 9BS
| Today | See what it's worth now |
| 8 Sep 2025 | £1,250,000 |
| 9 Jan 2003 | £490,000 |
No other historical records.
Springside Farm, Tismans Common, Rudgwick RH12 3DU
| Today | See what it's worth now |
| 2 Sep 2025 | £1,050,000 |
No other historical records.
The Lawley Cottage, Hermongers Lane, Rudgwick, Horsham RH12 3AH
| Today | See what it's worth now |
| 15 Aug 2025 | £380,000 |
No other historical records.
Windacres Bungalow, Church Street, Rudgwick RH12 3EG
| Today | See what it's worth now |
| 23 Jul 2025 | £915,000 |
No other historical records.
Wanford Mill, Haven Road, Horsham RH12 3JG
| Today | See what it's worth now |
| 16 Jul 2025 | £1,450,000 |
| 28 Jan 2020 | £1,250,000 |
Bells Wood, Furzen Lane, Ellens Green, Horsham RH12 3AR
| Today | See what it's worth now |
| 8 Jul 2025 | £1,310,000 |
| 13 Jun 2014 | £370,000 |
34, Woodfield Road, Horsham RH12 3EP
| Today | See what it's worth now |
| 18 Jun 2025 | £595,000 |
| 3 Feb 2014 | £375,000 |
No other historical records.
The Mill House, Gibbons Mill, The Haven, Billingshurst RH14 9BL

| Today | See what it's worth now |
| 22 Apr 2025 | £3,700,000 |
No other historical records.
Barnsfold, Barnsfold Lane, Horsham RH12 3BN
| Today | See what it's worth now |
| 8 Apr 2025 | £1,030,000 |
| 14 Aug 2020 | £975,000 |
7, Queen Elizabeth Road, Horsham RH12 3HL
| Today | See what it's worth now |
| 28 Mar 2025 | £400,000 |
| 23 Apr 2001 | £155,000 |
No other historical records.
4, Princess Margaret Road, Rudgwick RH12 3HN
| Today | See what it's worth now |
| 21 Mar 2025 | £280,000 |
No other historical records.
Lee Cottage, Loxwood Road, Horsham RH12 3DW
| Today | See what it's worth now |
| 21 Feb 2025 | £652,000 |
| 31 Jan 2013 | £475,000 |
48 Riders House, Woodfield Road, Horsham RH12 3EP

| Today | See what it's worth now |
| 3 Feb 2025 | £590,000 |
| 20 Aug 2021 | £627,500 |
Source Acknowledgement: © Crown copyright. England and Wales house price data is publicly available information produced by the HM Land Registry.This material was last updated on 9 July 2026. It covers the period from 1 January 1995 to 30 April 2026 and contains property transactions which have been registered during that period. Contains HM Land Registry data © Crown copyright and database right 2026. This data is licensed under the Open Government Licence v3.0.
Disclaimer: Rightmove.co.uk provides this HM Land Registry data "as is". The burden for fitness of the data relies completely with the user and is provided for informational purposes only. No warranty, express or implied, is given relating to the accuracy of content of the HM Land Registry data and Rightmove does not accept any liability for error or omission. If you have found an error with the data or need further information please contact HM Land Registry.
Permitted Use: Viewers of this Information are granted permission to access this Crown copyright material and to download it onto electronic, magnetic, optical or similar storage media provided that such activities are for private research, study or in-house use only. Any other use of the material requires the formal written permission of Land Registry which can be requested from us, and is subject to an additional licence and associated charge.
Rightmove takes no liability for your use of, or reliance on, Rightmove's Instant Valuation due to the limitations of our tracking tool listed here. Use of this tool is taken entirely at your own risk. All rights reserved.