
House Prices in Snorscomb
House prices in Snorscomb have an overall average of £396,653 over the last year.
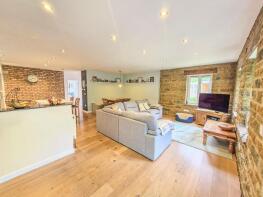
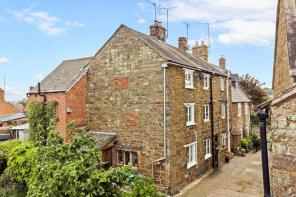
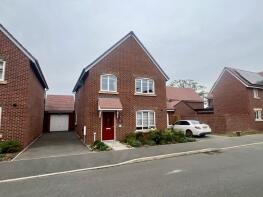
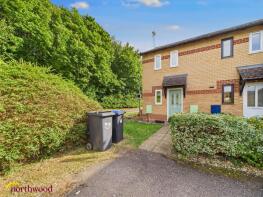
The majority of properties sold in Snorscomb during the last year were detached properties, selling for an average price of £511,222. Semi-detached properties sold for an average of £362,345, with terraced properties fetching £233,500.
Overall, the historical sold prices in Snorscomb over the last year were 3% up on the previous year and 3% down on the 2023 peak of £407,423.
Properties Sold
1 Mayfields, Manor Close, Daventry NN11 3YQ
| Today | See what it's worth now |
| 13 Apr 2026 | £645,000 |
| 10 Dec 2021 | £600,000 |
Rickyard House, Church Street, Daventry NN11 3YT

| Today | See what it's worth now |
| 27 Mar 2026 | £702,000 |
| 13 Dec 2019 | £520,000 |
2, Wild Cherry Close, Daventry NN11 3DL
| Today | See what it's worth now |
| 26 Mar 2026 | £375,000 |
| 14 Dec 2018 | £289,950 |
3, Mallard Drive, Daventry NN11 3EJ
| Today | See what it's worth now |
| 25 Mar 2026 | £160,000 |
| 12 Sep 2002 | £68,995 |
27, Winston Close, Daventry NN11 3NT
| Today | See what it's worth now |
| 20 Mar 2026 | £147,559 |
| 13 Jun 2003 | £83,000 |
No other historical records.
54 Heligan, Bradbury Road, Daventry NN11 3HD
| Today | See what it's worth now |
| 6 Mar 2026 | £575,000 |
| 4 Mar 2014 | £336,500 |
Byron House, Chapel Lane, Daventry NN11 3AQ
| Today | See what it's worth now |
| 6 Mar 2026 | £520,000 |
| 29 Jan 2016 | £327,500 |
No other historical records.
7, Hill View, Daventry NN11 3PB
| Today | See what it's worth now |
| 6 Mar 2026 | £900,000 |
| 31 Aug 2011 | £525,000 |
Rambler Cottage, School Hill, Daventry NN11 3HG
| Today | See what it's worth now |
| 27 Feb 2026 | £565,000 |
| 14 Sep 2021 | £510,000 |
2, Phipps Road, Daventry NN11 3TW
| Today | See what it's worth now |
| 27 Feb 2026 | £242,975 |
| 7 Feb 2025 | £110,000 |
20, Park Close, Daventry NN11 3AH
| Today | See what it's worth now |
| 27 Feb 2026 | £404,000 |
| 19 Feb 2019 | £343,000 |
12, High Street, Daventry NN11 3RQ
| Today | See what it's worth now |
| 6 Feb 2026 | £305,000 |
| 24 Jul 2015 | £225,000 |
43, Blacksmith Way, Daventry NN11 3UE
| Today | See what it's worth now |
| 6 Feb 2026 | £340,000 |
| 4 Mar 2021 | £287,500 |
11, Membris Way, Daventry NN11 3QZ
| Today | See what it's worth now |
| 4 Feb 2026 | £325,000 |
| 15 Oct 2015 | £205,000 |
1, Mallard Drive, Daventry NN11 3EJ
| Today | See what it's worth now |
| 30 Jan 2026 | £175,000 |
| 3 Nov 2014 | £110,000 |
5, Furniss Close, Daventry NN11 3TJ
| Today | See what it's worth now |
| 30 Jan 2026 | £265,000 |
| 20 Sep 2013 | £159,995 |
No other historical records.
10, The Witham, Daventry NN11 4QW
| Today | See what it's worth now |
| 30 Jan 2026 | £190,000 |
| 30 Sep 2002 | £38,500 |
No other historical records.
2, Partridge Close, Daventry NN11 3YP
| Today | See what it's worth now |
| 29 Jan 2026 | £392,000 |
| 2 Feb 2018 | £285,000 |
6, Lady Close, Daventry NN11 3HN
| Today | See what it's worth now |
| 27 Jan 2026 | £475,000 |
| 12 Aug 2015 | £252,000 |
28, Mallard Drive, Daventry NN11 3EJ
| Today | See what it's worth now |
| 23 Jan 2026 | £310,000 |
| 14 Mar 2012 | £169,000 |
51, High Street, Daventry NN11 3PP

| Today | See what it's worth now |
| 14 Jan 2026 | £660,000 |
| 25 Oct 2018 | £320,000 |
13, Derwent Close, Daventry NN11 4RA

| Today | See what it's worth now |
| 9 Jan 2026 | £211,000 |
| 29 Aug 2017 | £138,500 |
20, South Street, Daventry NN11 3RF
| Today | See what it's worth now |
| 6 Jan 2026 | £295,000 |
| 24 Sep 2021 | £249,950 |
Source Acknowledgement: © Crown copyright. England and Wales house price data is publicly available information produced by the HM Land Registry.This material was last updated on 9 July 2026. It covers the period from 1 January 1995 to 30 April 2026 and contains property transactions which have been registered during that period. Contains HM Land Registry data © Crown copyright and database right 2026. This data is licensed under the Open Government Licence v3.0.
Disclaimer: Rightmove.co.uk provides this HM Land Registry data "as is". The burden for fitness of the data relies completely with the user and is provided for informational purposes only. No warranty, express or implied, is given relating to the accuracy of content of the HM Land Registry data and Rightmove does not accept any liability for error or omission. If you have found an error with the data or need further information please contact HM Land Registry.
Permitted Use: Viewers of this Information are granted permission to access this Crown copyright material and to download it onto electronic, magnetic, optical or similar storage media provided that such activities are for private research, study or in-house use only. Any other use of the material requires the formal written permission of Land Registry which can be requested from us, and is subject to an additional licence and associated charge.
Rightmove takes no liability for your use of, or reliance on, Rightmove's Instant Valuation due to the limitations of our tracking tool listed here. Use of this tool is taken entirely at your own risk. All rights reserved.