
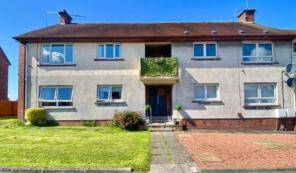
House Prices in South Belmont
House prices in South Belmont have an overall average of £161,248 over the last year.
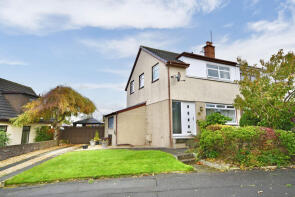
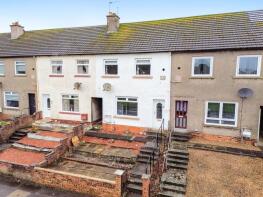
The majority of properties sold in South Belmont during the last year were terraced properties, selling for an average price of £127,892. Semi-detached properties sold for an average of £189,108, with detached properties fetching £258,741.
Overall, the historical sold prices in South Belmont over the last year were 2% down on the previous year and 1% up on the 2022 peak of £159,539.
Properties Sold
112, Burnbank Road, Ayr KA7 3QJ
| Today | See what it's worth now |
| 23 Apr 2026 | £135,000 |
| 31 Oct 2019 | £105,000 |
143, Glencairn Road, Ayr KA7 3HW
| Today | See what it's worth now |
| 23 Apr 2026 | £122,143 |
No other historical records.
15d, Anderson Crescent, Ayr KA7 3RL
| Today | See what it's worth now |
| 22 Apr 2026 | £67,000 |
| 3 Oct 2023 | £80,000 |
29, Stobhill Crescent, Ayr KA7 3LU
| Today | See what it's worth now |
| 22 Apr 2026 | £255,000 |
No other historical records.
4 Honeysuckle Park, Access To Honeysuckle And Rosebay Park's And Rush Hill, Ayr KA7 3YA

| Today | See what it's worth now |
| 21 Apr 2026 | £127,500 |
| 5 Feb 2024 | £115,000 |
85, Crofthead Road, Ayr KA7 3NE

| Today | See what it's worth now |
| 20 Apr 2026 | £190,000 |
| 27 Feb 2023 | £132,000 |
No other historical records.
84, Dalmellington Road, Ayr KA7 3PU
| Today | See what it's worth now |
| 15 Apr 2026 | £126,000 |
| 4 Nov 2005 | £107,995 |
No other historical records.
9a, Glendale Crescent, Ayr KA7 3SQ
| Today | See what it's worth now |
| 13 Apr 2026 | £53,000 |
| 26 Sep 2006 | £61,900 |
41, Masonhill Road, Ayr KA7 3NY
| Today | See what it's worth now |
| 13 Apr 2026 | £200,000 |
| 19 Nov 2013 | £137,500 |
28, Thistle Walk, Ayr KA7 3XH
| Today | See what it's worth now |
| 3 Apr 2026 | £105,000 |
| 13 Mar 2025 | £93,000 |
37, Glencairn Road, Ayr KA7 3HJ
| Today | See what it's worth now |
| 3 Apr 2026 | £111,000 |
| 24 Apr 2007 | £120,000 |
15, Chestnut Road, Ayr KA7 3NT
| Today | See what it's worth now |
| 2 Apr 2026 | £152,000 |
No other historical records.
6, Alder Bank, Ayr KA7 3NU
| Today | See what it's worth now |
| 2 Apr 2026 | £191,350 |
| 5 Aug 2015 | £139,000 |
168, Hillfoot Road, Ayr KA7 3LB

| Today | See what it's worth now |
| 1 Apr 2026 | £182,000 |
| 22 Dec 2020 | £155,000 |
16, Whiteford View, Ayr KA7 3LL
| Today | See what it's worth now |
| 30 Mar 2026 | £245,000 |
No other historical records.
24, Annfield Glen Road, Ayr KA7 3RP
| Today | See what it's worth now |
| 17 Mar 2026 | £140,000 |
No other historical records.
71, Hillfoot Road, Ayr KA7 3LD
| Today | See what it's worth now |
| 13 Mar 2026 | £150,000 |
| 8 Jun 2016 | £119,000 |
No other historical records.
9, Annfield Glen Road, Ayr KA7 3RR
| Today | See what it's worth now |
| 13 Mar 2026 | £100,000 |
| 4 Sep 2015 | £95,000 |
17, Camphill Place, Ayr KA7 3NN
| Today | See what it's worth now |
| 9 Mar 2026 | £176,350 |
| 26 May 2006 | £140,000 |
46, Cunningham Crescent, Ayr KA7 3JA
| Today | See what it's worth now |
| 3 Mar 2026 | £160,000 |
| 2 Sep 2016 | £95,500 |
No other historical records.
48, Caledonia Road, Ayr KA7 3HU
| Today | See what it's worth now |
| 27 Feb 2026 | £100,000 |
No other historical records.
25, Dalmellington Road, Ayr KA7 3TJ
| Today | See what it's worth now |
| 23 Feb 2026 | £250,000 |
No other historical records.
8, Marigold Square, Ayr KA7 3YH
| Today | See what it's worth now |
| 20 Feb 2026 | £125,000 |
| 6 Jun 2002 | £17,100 |
No other historical records.
Source Acknowledgement: © Crown copyright. Scottish house price data is publicly available information produced by the Registers of Scotland. Material has been reproduced with the permission of the Keeper of the Registers of Scotland and contains data compiled by Registers of Scotland. For further information, please contact data@ros.gov.uk. Please note the dates shown here relate to the property's registered date not sold date.This material was last updated on 10 July 2026. It covers the period from 8 December 1987 to 30 April 2026 and contains property transactions which have been registered during that period.
Disclaimer: Rightmove.co.uk provides this Registers of Scotland data "as is". The burden for fitness of the data relies completely with the user and is provided for informational purposes only. No warranty, express or implied, is given relating to the accuracy of content of the Registers of Scotland data and Rightmove plc does not accept any liability for error or omission. If you have found an error with the data or need further information please contact data@ros.gov.uk
Permitted Use: The Registers of Scotland allows the reproduction of the data which it provides to Rightmove.co.uk free of charge in any format or medium only for research, private study or for internal circulation within an organisation. This is subject to it being reproduced accurately and not used in a misleading context. The material must be acknowledged as Crown Copyright. You are not allowed to use this information for commercial purposes, nor must you copy, distribute, sell or publish the data in any way. For any other use of this material, please apply to the Registers of Scotland for a licence. You can do this online at www.ros.gov.uk, by email at data@ros.gov.uk or by writing to Business Development, Registers of Scotland, Meadowbank House, 153 London Road, Edinburgh EH8 7AU.
Rightmove takes no liability for your use of, or reliance on, Rightmove's Instant Valuation due to the limitations of our tracking tool listed here. Use of this tool is taken entirely at your own risk. All rights reserved.