
House Prices in South Field
House prices in South Field have an overall average of £280,824 over the last year.
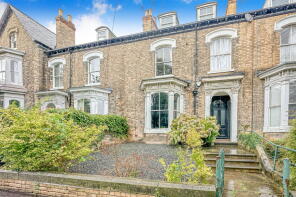
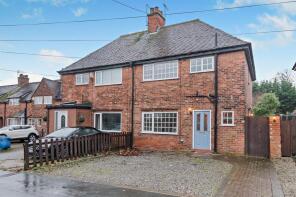
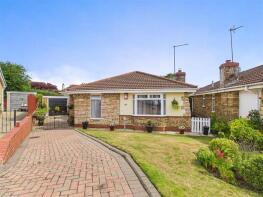
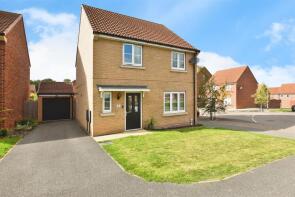
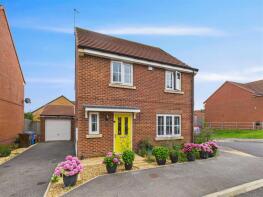
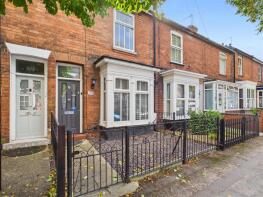
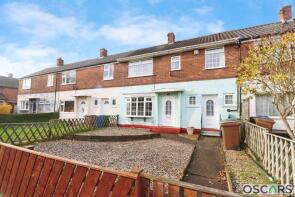
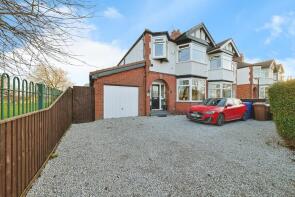
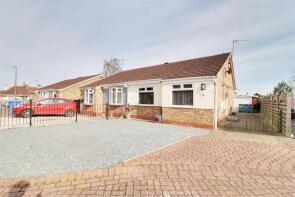
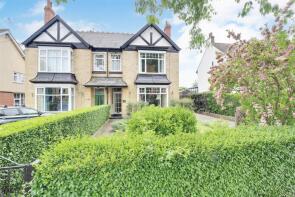
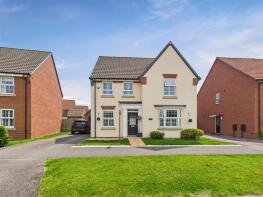
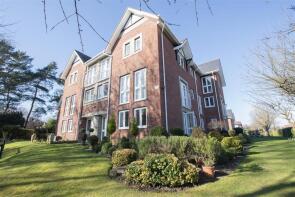
The majority of properties sold in South Field during the last year were semi-detached properties, selling for an average price of £274,543. Detached properties sold for an average of £379,326, with terraced properties fetching £187,271.
Overall, the historical sold prices in South Field over the last year were 7% up on the previous year and similar to the 2022 peak of £278,347.
Properties Sold
30, Ferriby Road, Hessle HU13 0PG
| Today | See what it's worth now |
| 2 Apr 2026 | £365,000 |
| 19 Dec 2003 | £225,000 |
No other historical records.
12, Tennison Walk, Hessle HU13 0FL

| Today | See what it's worth now |
| 31 Mar 2026 | £225,000 |
| 22 Sep 2017 | £199,995 |
No other historical records.
6, Mount Avenue, Hessle HU13 0QD
| Today | See what it's worth now |
| 31 Mar 2026 | £177,000 |
| 15 Jun 2001 | £43,000 |
No other historical records.
55, Elsham Rise, Hessle HU13 0HP
| Today | See what it's worth now |
| 24 Mar 2026 | £338,000 |
| 7 Nov 2013 | £185,000 |
No other historical records.
9, Holly Drive, Hessle HU13 0QP
| Today | See what it's worth now |
| 23 Mar 2026 | £283,500 |
| 27 May 2016 | £224,950 |
No other historical records.
50, Cherry Avenue, Hessle HU13 0QT
| Today | See what it's worth now |
| 6 Mar 2026 | £245,000 |
| 28 Mar 2018 | £234,950 |
No other historical records.
36, Cherry Avenue, Hessle HU13 0QT
| Today | See what it's worth now |
| 27 Feb 2026 | £291,000 |
| 7 Jun 2023 | £274,000 |
Keepers Cottage, Jenny Brough Lane, Hessle HU13 0JZ
| Today | See what it's worth now |
| 26 Feb 2026 | £300,000 |
| 8 Dec 2017 | £250,000 |
No other historical records.
68, Westbourne Grove, Hessle HU13 0QL
| Today | See what it's worth now |
| 25 Feb 2026 | £190,000 |
| 20 Dec 2019 | £179,950 |
6, Thornton Close, Hessle HU13 0HQ
| Today | See what it's worth now |
| 23 Feb 2026 | £235,000 |
| 24 Aug 2018 | £191,000 |
32, Danes Drive, Hessle HU13 0BT
| Today | See what it's worth now |
| 12 Feb 2026 | £123,000 |
No other historical records.
241, Boothferry Road, Hessle HU13 0NG
| Today | See what it's worth now |
| 5 Feb 2026 | £340,000 |
| 14 Dec 2018 | £268,000 |
72, Westbourne Grove, Hessle HU13 0QL
| Today | See what it's worth now |
| 5 Feb 2026 | £197,000 |
| 18 Aug 2005 | £118,000 |
No other historical records.
39, Salisbury Street, Hessle HU13 0SE

| Today | See what it's worth now |
| 30 Jan 2026 | £215,000 |
| 25 Jan 2008 | £132,450 |
No other historical records.
65, Elsham Rise, Hessle HU13 0HP
| Today | See what it's worth now |
| 29 Jan 2026 | £225,000 |
| 28 Aug 2020 | £164,950 |
No other historical records.
21, Marlborough Avenue, Hessle HU13 0PN
| Today | See what it's worth now |
| 29 Jan 2026 | £372,500 |
No other historical records.
43, Broad Avenue, Hessle HU13 0FH
| Today | See what it's worth now |
| 23 Jan 2026 | £394,950 |
| 19 Jan 2018 | £364,995 |
No other historical records.
10, Barrow Lane, Hessle HU13 0PH

| Today | See what it's worth now |
| 16 Jan 2026 | £135,000 |
No other historical records.
9, Hudson Court, Barrow Lane, Hessle HU13 0PE
| Today | See what it's worth now |
| 9 Jan 2026 | £108,000 |
| 12 Aug 2010 | £110,000 |
28, Bon Accord Road, Hessle HU13 0AZ
| Today | See what it's worth now |
| 9 Jan 2026 | £172,000 |
| 2 Aug 2022 | £161,000 |
11, Cherry Avenue, Hessle HU13 0QT
| Today | See what it's worth now |
| 9 Jan 2026 | £455,000 |
| 31 Oct 2016 | £334,950 |
No other historical records.
23, Headlands Drive, Hessle HU13 0JP
| Today | See what it's worth now |
| 9 Jan 2026 | £325,000 |
No other historical records.
5, Bon Accord Road, Hessle HU13 0AZ
| Today | See what it's worth now |
| 12 Dec 2025 | £155,000 |
| 2 Jul 2018 | £113,000 |
Source Acknowledgement: © Crown copyright. England and Wales house price data is publicly available information produced by the HM Land Registry.This material was last updated on 9 July 2026. It covers the period from 1 January 1995 to 30 April 2026 and contains property transactions which have been registered during that period. Contains HM Land Registry data © Crown copyright and database right 2026. This data is licensed under the Open Government Licence v3.0.
Disclaimer: Rightmove.co.uk provides this HM Land Registry data "as is". The burden for fitness of the data relies completely with the user and is provided for informational purposes only. No warranty, express or implied, is given relating to the accuracy of content of the HM Land Registry data and Rightmove does not accept any liability for error or omission. If you have found an error with the data or need further information please contact HM Land Registry.
Permitted Use: Viewers of this Information are granted permission to access this Crown copyright material and to download it onto electronic, magnetic, optical or similar storage media provided that such activities are for private research, study or in-house use only. Any other use of the material requires the formal written permission of Land Registry which can be requested from us, and is subject to an additional licence and associated charge.
Rightmove takes no liability for your use of, or reliance on, Rightmove's Instant Valuation due to the limitations of our tracking tool listed here. Use of this tool is taken entirely at your own risk. All rights reserved.