
House Prices in South Harting
House prices in South Harting have an overall average of £429,904 over the last year.
The majority of properties sold in South Harting during the last year were detached properties, selling for an average price of £610,000. Semi-detached properties sold for an average of £392,500, with terraced properties fetching £287,212.
Overall, the historical sold prices in South Harting over the last year were 15% down on the previous year and 41% down on the 2022 peak of £725,714.
Properties Sold
White House, North Lane, Petersfield GU31 5PZ
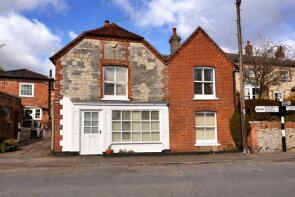
| Today | See today's value |
| 31 Jul 2026 | £276,925 |
| 17 Sep 2021 | £328,000 |
Rock Cottage, Elsted Road, Petersfield GU31 5LD

| Today | See today's value |
| 3 Jul 2026 | £740,000 |
| 29 Jan 2021 | £645,000 |
13, Culvers, Petersfield GU31 5LG

| Today | See today's value |
| 10 Feb 2026 | £340,000 |
| 4 Dec 2014 | £270,000 |
No other historical records.
6, The Hop Garden, Petersfield GU31 5QL

| Today | See today's value |
| 9 Jan 2026 | £480,000 |
| 16 Mar 2018 | £400,000 |
5, Culvers, Petersfield GU31 5LG

| Today | See today's value |
| 15 Dec 2025 | £445,000 |
| 10 Mar 2017 | £300,000 |
No other historical records.
2, The Square, South Harting GU31 5PX
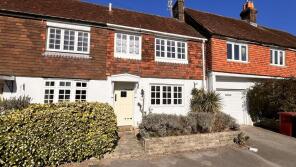
| Today | See today's value |
| 3 Dec 2025 | £297,500 |
No other historical records.
6, Wellfield Cottages, Tipper Lane, Petersfield GU31 5QN
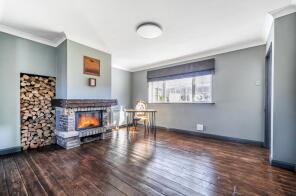
| Today | See today's value |
| 20 Aug 2025 | £395,000 |
| 17 Aug 2018 | £257,000 |
No other historical records.
2, Jenny Lake Row, The Street, Petersfield GU31 5QD

| Today | See today's value |
| 12 Aug 2025 | £355,000 |
| 30 May 2018 | £280,000 |
No other historical records.
Appledore, Mill Lane, South Harting GU31 5LD
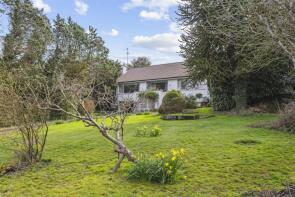
| Today | See today's value |
| 6 Aug 2025 | £861,000 |
No other historical records.
33, South Acre, Petersfield GU31 5LL

| Today | See today's value |
| 8 Jul 2025 | £830,000 |
| 28 Jul 2023 | £900,000 |
Little House, The Street, Petersfield GU31 5QB

| Today | See today's value |
| 18 Jun 2025 | £685,000 |
| 30 May 2018 | £495,000 |
11, Warren Side, South Harting GU31 5LQ

| Today | See today's value |
| 2 Apr 2025 | £305,000 |
No other historical records.
7, The Hop Garden, Petersfield GU31 5QL

| Today | See today's value |
| 25 Mar 2025 | £490,000 |
| 10 Sep 2014 | £388,000 |
3, Mead Cottages, North Lane, South Harting GU31 5NP
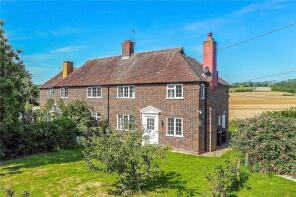
| Today | See today's value |
| 20 Feb 2025 | £555,000 |
No other historical records.
46, Culvers, Petersfield GU31 5LE

| Today | See today's value |
| 31 Jan 2025 | £467,500 |
| 22 Aug 2014 | £288,000 |
No other historical records.
6, Culvers, Petersfield GU31 5LG
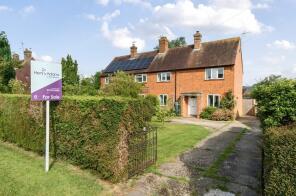
| Today | See today's value |
| 17 Jan 2025 | £470,000 |
| 27 Mar 2014 | £250,000 |
No other historical records.
Lutterworth, North Lane, South Harting GU31 5PZ

| Today | See today's value |
| 13 Dec 2024 | £850,000 |
No other historical records.
42, Warren Side, South Harting GU31 5LQ

| Today | See today's value |
| 6 Dec 2024 | £170,000 |
No other historical records.
18, South Acre, South Harting GU31 5LJ

| Today | See today's value |
| 5 Dec 2024 | £448,570 |
No other historical records.
21, South Acre, Petersfield GU31 5LJ

| Today | See today's value |
| 3 Dec 2024 | £575,000 |
| 20 Jun 2016 | £300,000 |
No other historical records.
9, South Gardens, South Harting GU31 5QJ
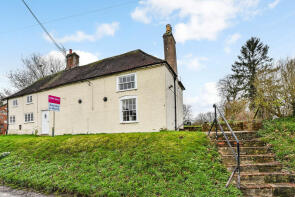
| Today | See today's value |
| 25 Oct 2024 | £405,000 |
No other historical records.
10, The Square, Petersfield GU31 5PX
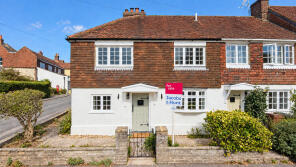
| Today | See today's value |
| 2 Oct 2024 | £350,000 |
| 27 Feb 2015 | £475,000 |
No other historical records.
8, South Gardens, Petersfield GU31 5QJ
| Today | See today's value |
| 17 Sep 2024 | £375,000 |
No other historical records.

Rightmove takes no liability for your use of, or reliance on, Rightmove's Instant Valuation due to the limitations of our tracking tool listed here. Use of this tool is taken entirely at your own risk. All rights reserved.