
House Prices in Swanwick
House prices in Swanwick have an overall average of £455,199 over the last year.
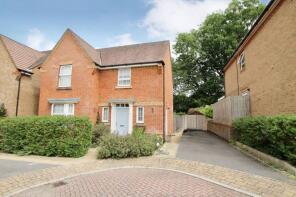
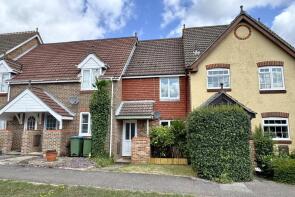
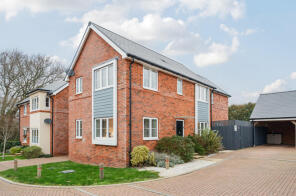
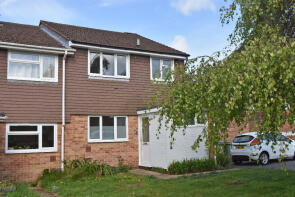
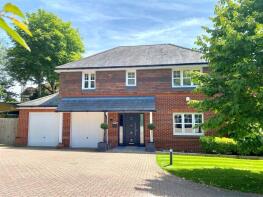
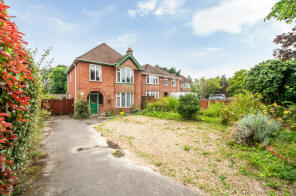
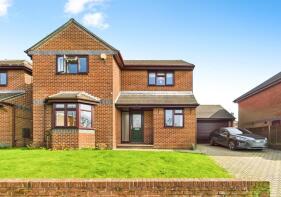
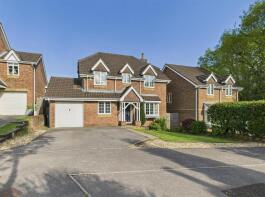
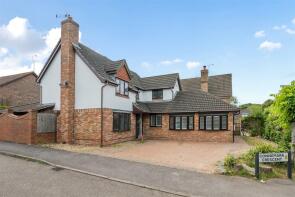
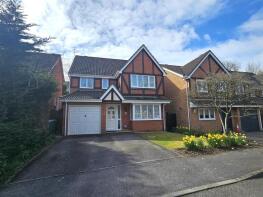
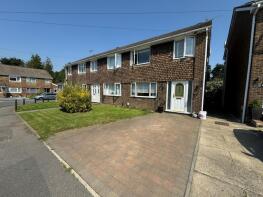
The majority of properties sold in Swanwick during the last year were detached properties, selling for an average price of £582,083. Terraced properties sold for an average of £272,500, with semi-detached properties fetching £367,090.
Overall, the historical sold prices in Swanwick over the last year were 8% down on the previous year and 7% down on the 2023 peak of £490,515.
Properties Sold
8, Danube Drive, Swanwick, Southampton SO31 1ER
| Today | See what it's worth now |
| 5 Dec 2025 | £470,000 |
| 29 Jun 2012 | £379,999 |
No other historical records.
29, Clydesdale Road, Whiteley, Fareham PO15 7BD
| Today | See what it's worth now |
| 28 Nov 2025 | £280,000 |
| 28 Jan 2021 | £220,000 |
24, Compass Way, Swanwick, Southampton SO31 7PS
| Today | See what it's worth now |
| 21 Nov 2025 | £505,000 |
| 31 Aug 2017 | £384,995 |
No other historical records.
15, Sopwith Way, Swanwick, Southampton SO31 7AY
| Today | See what it's worth now |
| 13 Nov 2025 | £730,000 |
| 20 Aug 1999 | £173,000 |
No other historical records.
26, Lower Swanwick Road, Swanwick, Southampton SO31 7HH
| Today | See what it's worth now |
| 13 Oct 2025 | £265,000 |
| 1 Nov 2002 | £132,500 |
No other historical records.
105, Swanwick Lane, Swanwick, Southampton SO31 7DX
| Today | See what it's worth now |
| 10 Oct 2025 | £800,000 |
| 21 May 2014 | £487,500 |
145, Swanwick Lane, Swanwick, Southampton SO31 7HB
| Today | See what it's worth now |
| 19 Sep 2025 | £460,000 |
| 13 Jun 1997 | £109,500 |
No other historical records.
1, Baytree Cottages, Swanwick Shore Road, Swanwick, Southampton SO31 7EF

| Today | See what it's worth now |
| 29 Aug 2025 | £353,000 |
| 16 Nov 2018 | £230,000 |
No other historical records.
323, Old Swanwick Lane, Lower Swanwick, Southampton SO31 7GS
| Today | See what it's worth now |
| 29 Aug 2025 | £570,000 |
| 4 Sep 2015 | £396,000 |
43, Anglers Way, Southampton SO31 7JH
| Today | See what it's worth now |
| 26 Aug 2025 | £560,000 |
| 22 Nov 2005 | £307,000 |
1, Connemara Crescent, Whiteley, Fareham PO15 7BN
| Today | See what it's worth now |
| 18 Aug 2025 | £670,000 |
| 29 Mar 2018 | £535,000 |
17, Andalusian Gardens, Whiteley, Fareham PO15 7DU
| Today | See what it's worth now |
| 4 Aug 2025 | £495,000 |
| 4 Dec 1995 | £99,995 |
No other historical records.
172a, Swanwick Lane, Swanwick, Southampton SO31 7GZ

| Today | See what it's worth now |
| 25 Jul 2025 | £350,000 |
| 20 Sep 2019 | £315,000 |
No other historical records.
8, Lawson Close, Swanwick, Southampton SO31 7DJ
| Today | See what it's worth now |
| 25 Jul 2025 | £320,000 |
| 7 Oct 2013 | £175,000 |
21, Clydesdale Road, Whiteley, Fareham PO15 7BD
| Today | See what it's worth now |
| 13 Jun 2025 | £270,000 |
| 17 May 2019 | £234,500 |
40, Suffolk Drive, Whiteley, Fareham PO15 7DH

| Today | See what it's worth now |
| 2 Jun 2025 | £237,500 |
| 25 Oct 2021 | £200,000 |
17, Jutland Close, Whiteley, Fareham PO15 7DQ
| Today | See what it's worth now |
| 19 May 2025 | £262,500 |
| 19 May 2017 | £210,000 |
216, Botley Road, Southampton SO31 1BL

| Today | See what it's worth now |
| 13 May 2025 | £955,000 |
| 26 Jul 2016 | £870,000 |
35, Castilian Way, Whiteley, Fareham PO15 7NR
| Today | See what it's worth now |
| 28 Apr 2025 | £205,000 |
| 10 Jun 2015 | £172,000 |
The Nest, Glen Road, Swanwick, Southampton SO31 7HD
| Today | See what it's worth now |
| 17 Apr 2025 | £420,000 |
| 29 Mar 2021 | £330,000 |
12, Castilian Way, Whiteley, Fareham PO15 7NR
| Today | See what it's worth now |
| 10 Apr 2025 | £381,180 |
| 10 Dec 2010 | £218,178 |
No other historical records.
10, Danube Drive, Swanwick, Southampton SO31 1ER
| Today | See what it's worth now |
| 28 Mar 2025 | £380,000 |
| 12 May 2016 | £315,000 |
45, Clydesdale Road, Whiteley, Fareham PO15 7BD
| Today | See what it's worth now |
| 28 Mar 2025 | £275,000 |
No other historical records.
1, Suffolk Drive, Whiteley, Fareham PO15 7DE
| Today | See what it's worth now |
| 27 Mar 2025 | £293,000 |
| 1 Mar 2023 | £249,000 |
8, Quay Haven, Swanwick, Southampton SO31 7DE
| Today | See what it's worth now |
| 21 Mar 2025 | £745,000 |
No other historical records.
Source Acknowledgement: © Crown copyright. England and Wales house price data is publicly available information produced by the HM Land Registry.This material was last updated on 4 February 2026. It covers the period from 1 January 1995 to 24 December 2025 and contains property transactions which have been registered during that period. Contains HM Land Registry data © Crown copyright and database right 2026. This data is licensed under the Open Government Licence v3.0.
Disclaimer: Rightmove.co.uk provides this HM Land Registry data "as is". The burden for fitness of the data relies completely with the user and is provided for informational purposes only. No warranty, express or implied, is given relating to the accuracy of content of the HM Land Registry data and Rightmove does not accept any liability for error or omission. If you have found an error with the data or need further information please contact HM Land Registry.
Permitted Use: Viewers of this Information are granted permission to access this Crown copyright material and to download it onto electronic, magnetic, optical or similar storage media provided that such activities are for private research, study or in-house use only. Any other use of the material requires the formal written permission of Land Registry which can be requested from us, and is subject to an additional licence and associated charge.
Map data ©OpenStreetMap contributors.
Rightmove takes no liability for your use of, or reliance on, Rightmove's Instant Valuation due to the limitations of our tracking tool listed here. Use of this tool is taken entirely at your own risk. All rights reserved.