
House Prices in Symonds Hyde
House prices in Symonds Hyde have an overall average of £411,066 over the last year.
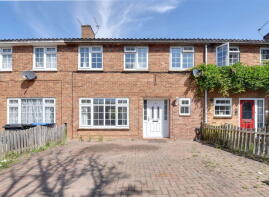
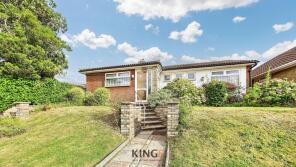
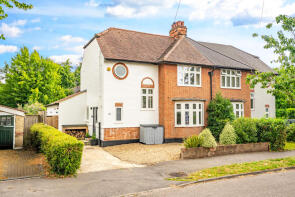
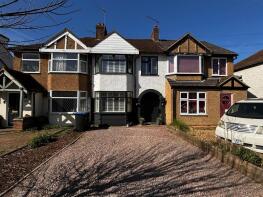
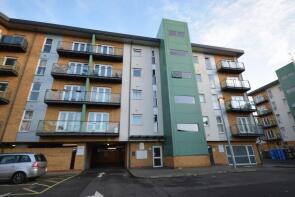
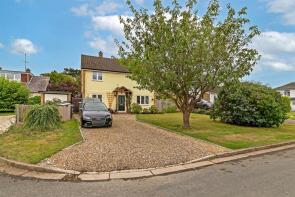
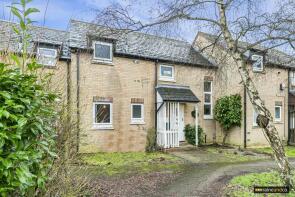
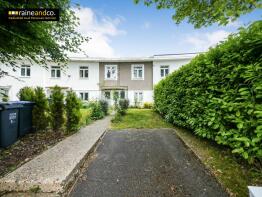
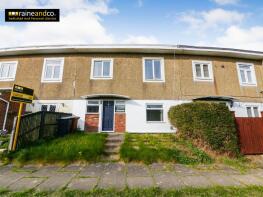
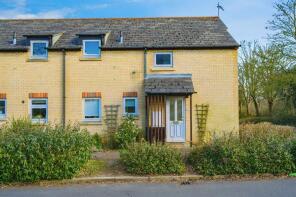
The majority of properties sold in Symonds Hyde during the last year were terraced properties, selling for an average price of £388,232. Semi-detached properties sold for an average of £496,792, with flats fetching £232,978.
Overall, the historical sold prices in Symonds Hyde over the last year were 1% up on the previous year and similar to the 2023 peak of £414,501.
Properties Sold
65, Bradshaws, Hatfield AL10 9QW
| Today | See what it's worth now |
| 5 Dec 2025 | £355,000 |
| 28 Aug 2015 | £270,000 |
4, Hilbury, Hatfield AL10 9HG
| Today | See what it's worth now |
| 1 Dec 2025 | £445,000 |
| 10 Sep 1998 | £158,500 |
No other historical records.
26, Green Lanes, Hatfield AL10 9JU
| Today | See what it's worth now |
| 28 Nov 2025 | £465,000 |
| 29 May 2020 | £405,000 |
No other historical records.
4, Selwyn Avenue, Hatfield AL10 9NP
| Today | See what it's worth now |
| 28 Nov 2025 | £750,000 |
| 19 Oct 2018 | £510,000 |
No other historical records.
28, Green Lanes, Hatfield AL10 9JU
| Today | See what it's worth now |
| 28 Nov 2025 | £460,000 |
| 19 Dec 2016 | £335,000 |
No other historical records.
28, Lavender Close, Hatfield AL10 9FW

| Today | See what it's worth now |
| 24 Nov 2025 | £635,000 |
| 30 Mar 2004 | £295,000 |
No other historical records.
22, Parkhouse Court, Hatfield AL10 9QZ
| Today | See what it's worth now |
| 17 Nov 2025 | £220,250 |
| 6 Nov 2014 | £212,500 |
14, Dragon Road, Hatfield AL10 9LX

| Today | See what it's worth now |
| 31 Oct 2025 | £390,000 |
No other historical records.
25, Roe Green Close, Hatfield AL10 9PD
| Today | See what it's worth now |
| 31 Oct 2025 | £670,000 |
| 28 Feb 2011 | £310,000 |
No other historical records.
11, The Sidings, Hatfield AL10 9SP
| Today | See what it's worth now |
| 24 Oct 2025 | £345,000 |
| 24 Feb 2003 | £158,995 |
52, Gorseway, Hatfield AL10 9GS
| Today | See what it's worth now |
| 23 Oct 2025 | £264,000 |
| 21 Oct 2021 | £245,000 |
51, Hazel Grove, Hatfield AL10 9DJ
| Today | See what it's worth now |
| 17 Oct 2025 | £360,000 |
| 16 Oct 2015 | £255,000 |
14, Lavender Close, Hatfield AL10 9FW
| Today | See what it's worth now |
| 10 Oct 2025 | £617,000 |
| 28 Nov 2003 | £279,945 |
No other historical records.
66, Gorseway, Hatfield AL10 9GS
| Today | See what it's worth now |
| 10 Oct 2025 | £427,000 |
| 1 Apr 2016 | £340,000 |
51, Nimrod Drive, Hatfield AL10 9LS
| Today | See what it's worth now |
| 1 Oct 2025 | £357,000 |
| 13 Dec 2019 | £305,000 |
46, Daffodil Close, Hatfield AL10 9FF
| Today | See what it's worth now |
| 22 Sep 2025 | £645,000 |
| 26 Sep 2003 | £289,000 |
No other historical records.
178, Parkhouse Court, Hatfield AL10 9RD
| Today | See what it's worth now |
| 19 Sep 2025 | £180,000 |
| 3 Jun 2016 | £180,000 |
No other historical records.
34, Cornflower Way, Hatfield AL10 9FY
| Today | See what it's worth now |
| 19 Sep 2025 | £198,000 |
| 31 Jul 2018 | £207,000 |
91, Hazel Grove, Hatfield AL10 9DR
| Today | See what it's worth now |
| 12 Sep 2025 | £315,000 |
| 1 May 2015 | £220,000 |
57, Willow Way, Hatfield AL10 9QD
| Today | See what it's worth now |
| 5 Sep 2025 | £290,000 |
| 2 Oct 1998 | £68,000 |
No other historical records.
67, Selwyn Crescent, Hatfield AL10 9NW

| Today | See what it's worth now |
| 3 Sep 2025 | £762,500 |
| 5 Jun 2003 | £320,000 |
53, Hazel Grove, Hatfield AL10 9DJ
| Today | See what it's worth now |
| 1 Sep 2025 | £252,000 |
| 6 Mar 2015 | £235,000 |
2, Crossbrook, Hatfield AL10 9SS
| Today | See what it's worth now |
| 29 Aug 2025 | £390,000 |
| 10 Jul 2015 | £275,000 |
15, Brookside, Hatfield AL10 9RR
| Today | See what it's worth now |
| 29 Aug 2025 | £605,000 |
| 15 May 2014 | £440,000 |
2, Devon Mead, Hatfield AL10 9GD
| Today | See what it's worth now |
| 28 Aug 2025 | £567,500 |
| 19 Jan 2018 | £425,000 |
Source Acknowledgement: © Crown copyright. England and Wales house price data is publicly available information produced by the HM Land Registry.This material was last updated on 4 February 2026. It covers the period from 1 January 1995 to 24 December 2025 and contains property transactions which have been registered during that period. Contains HM Land Registry data © Crown copyright and database right 2026. This data is licensed under the Open Government Licence v3.0.
Disclaimer: Rightmove.co.uk provides this HM Land Registry data "as is". The burden for fitness of the data relies completely with the user and is provided for informational purposes only. No warranty, express or implied, is given relating to the accuracy of content of the HM Land Registry data and Rightmove does not accept any liability for error or omission. If you have found an error with the data or need further information please contact HM Land Registry.
Permitted Use: Viewers of this Information are granted permission to access this Crown copyright material and to download it onto electronic, magnetic, optical or similar storage media provided that such activities are for private research, study or in-house use only. Any other use of the material requires the formal written permission of Land Registry which can be requested from us, and is subject to an additional licence and associated charge.
Map data ©OpenStreetMap contributors.
Rightmove takes no liability for your use of, or reliance on, Rightmove's Instant Valuation due to the limitations of our tracking tool listed here. Use of this tool is taken entirely at your own risk. All rights reserved.