
House Prices in TD1
House prices in TD1 have an overall average of £187,662 over the last year.
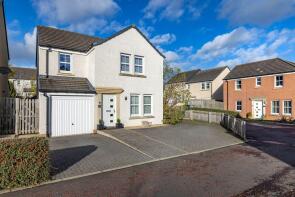
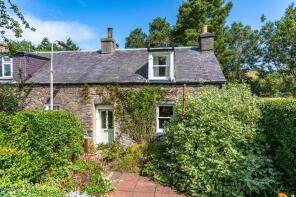
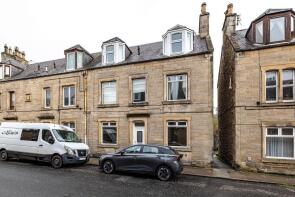
The majority of properties sold in TD1 during the last year were flats, selling for an average price of £101,810. Detached properties sold for an average of £354,297, with terraced properties fetching £160,737.
Overall, the historical sold prices in TD1 over the last year were 9% up on the previous year and 12% up on the 2023 peak of £168,087.
Properties Sold
55, Victoria Street, Galashiels TD1 1HH

| Today | See what it's worth now |
| 30 Apr 2026 | £75,000 |
| 28 Oct 2015 | £60,000 |
21, Kingfisher Grove, Galashiels TD1 2QH
| Today | See what it's worth now |
| 29 Apr 2026 | £260,000 |
| 11 Aug 2022 | £255,000 |
10 Mossend Cottage, Cotland Place, Galashiels TD1 2QP
| Today | See what it's worth now |
| 29 Apr 2026 | £125,000 |
| 22 Sep 2014 | £75,000 |
No other historical records.
7, St Andrew Street, Galashiels TD1 1EA
| Today | See what it's worth now |
| 28 Apr 2026 | £90,000 |
No other historical records.
15, Balnakiel Terrace, Galashiels TD1 1RW
| Today | See what it's worth now |
| 28 Apr 2026 | £158,150 |
No other historical records.
4, Roxburgh Place, Galashiels TD1 1HE
| Today | See what it's worth now |
| 28 Apr 2026 | £109,000 |
| 25 Aug 2021 | £105,000 |
6, Roxburgh Street, Galashiels TD1 1PF
| Today | See what it's worth now |
| 27 Apr 2026 | £110,000 |
| 16 Apr 2008 | £120,000 |
No other historical records.
149, High Street, Galashiels TD1 1RZ
| Today | See what it's worth now |
| 27 Apr 2026 | £59,000 |
| 12 Oct 2015 | £48,650 |
180, Croft Street, Galashiels TD1 3BS
| Today | See what it's worth now |
| 27 Apr 2026 | £125,000 |
| 19 Dec 2022 | £120,000 |
3, Bluebell Lane, Galashiels TD1 2NA
| Today | See what it's worth now |
| 23 Apr 2026 | £110,000 |
No other historical records.
121, Galashiels Road, Galashiels TD1 2RF
| Today | See what it's worth now |
| 21 Apr 2026 | £39,999 |
| 16 Nov 2005 | £64,000 |
189, Magdala Terrace, Galashiels TD1 2HZ
| Today | See what it's worth now |
| 20 Apr 2026 | £107,000 |
| 31 May 2022 | £80,000 |
1, John Collins Crescent, Galashiels TD1 2FA
| Today | See what it's worth now |
| 20 Apr 2026 | £260,000 |
| 28 Oct 2022 | £165,000 |
No other historical records.
3, Gala Water Apartments, Gala Lane, Galashiels TD1 3BD
| Today | See what it's worth now |
| 20 Apr 2026 | £175,000 |
| 29 Jul 2021 | £140,000 |
No other historical records.
20, Ladhope Drive, Galashiels TD1 2BL

| Today | See what it's worth now |
| 17 Apr 2026 | £200,000 |
| 2 Oct 2020 | £154,000 |
58, Kirk Brae, Galashiels TD1 1NH

| Today | See what it's worth now |
| 14 Apr 2026 | £33,000 |
| 2 Jun 2025 | £45,000 |
131, High Street, Galashiels TD1 1RZ

| Today | See what it's worth now |
| 10 Apr 2026 | £63,000 |
| 21 Feb 2003 | £35,250 |
No other historical records.
19, Woodside Place, Galashiels TD1 1RE

| Today | See what it's worth now |
| 9 Apr 2026 | £110,000 |
| 1 Nov 2022 | £103,000 |
16, Barr Road, Galashiels TD1 3HX
| Today | See what it's worth now |
| 8 Apr 2026 | £485,000 |
| 2 Aug 2021 | £430,000 |
No other historical records.
10, Annfield Gardens, Galashiels TD1 3DE
| Today | See what it's worth now |
| 8 Apr 2026 | £290,000 |
| 16 Jun 2008 | £200,000 |
No other historical records.
1, Knoll Park Place, Galashiels TD1 2ES
| Today | See what it's worth now |
| 8 Apr 2026 | £250,000 |
| 20 Dec 2022 | £237,995 |
No other historical records.
3, Abbotsview Gardens, Galashiels TD1 3ER
| Today | See what it's worth now |
| 8 Apr 2026 | £320,000 |
| 12 Sep 2023 | £283,000 |
7, Balnakiel Terrace, Galashiels TD1 1RW
| Today | See what it's worth now |
| 3 Apr 2026 | £150,000 |
| 19 Nov 2003 | £60,000 |
No other historical records.
Source Acknowledgement: © Crown copyright. Scottish house price data is publicly available information produced by the Registers of Scotland. Material has been reproduced with the permission of the Keeper of the Registers of Scotland and contains data compiled by Registers of Scotland. For further information, please contact data@ros.gov.uk. Please note the dates shown here relate to the property's registered date not sold date.This material was last updated on 10 July 2026. It covers the period from 8 December 1987 to 30 April 2026 and contains property transactions which have been registered during that period.
Disclaimer: Rightmove.co.uk provides this Registers of Scotland data "as is". The burden for fitness of the data relies completely with the user and is provided for informational purposes only. No warranty, express or implied, is given relating to the accuracy of content of the Registers of Scotland data and Rightmove plc does not accept any liability for error or omission. If you have found an error with the data or need further information please contact data@ros.gov.uk
Permitted Use: The Registers of Scotland allows the reproduction of the data which it provides to Rightmove.co.uk free of charge in any format or medium only for research, private study or for internal circulation within an organisation. This is subject to it being reproduced accurately and not used in a misleading context. The material must be acknowledged as Crown Copyright. You are not allowed to use this information for commercial purposes, nor must you copy, distribute, sell or publish the data in any way. For any other use of this material, please apply to the Registers of Scotland for a licence. You can do this online at www.ros.gov.uk, by email at data@ros.gov.uk or by writing to Business Development, Registers of Scotland, Meadowbank House, 153 London Road, Edinburgh EH8 7AU.
Rightmove takes no liability for your use of, or reliance on, Rightmove's Instant Valuation due to the limitations of our tracking tool listed here. Use of this tool is taken entirely at your own risk. All rights reserved.