
House Prices in TR26 1JG
House prices in TR26 1JG have an overall average of £364,000 over the last year.
Overall, the historical sold prices in TR26 1JG over the last year were 63% down on the previous year and 48% down on the 2013 peak of £700,000.
Properties Sold
Ground Floor Flat 1, 3, Clodgy View, St Ives TR26 1JG

| Today | See what it's worth now |
| 28 Mar 2025 | £364,000 |
| 3 Jul 2017 | £340,000 |
7, Clodgy View, St Ives TR26 1JG
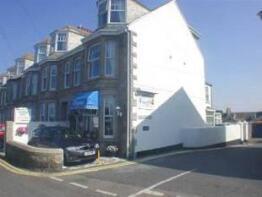
| Today | See what it's worth now |
| 14 Jun 2024 | £980,000 |
No other historical records.
The Owls Nest, Clodgy View, St. Ives TR26 1JG

| Today | See what it's worth now |
| 18 Nov 2022 | £435,000 |
| 20 Oct 1999 | £89,950 |
Hillsboro, Clodgy View, St. Ives TR26 1JG
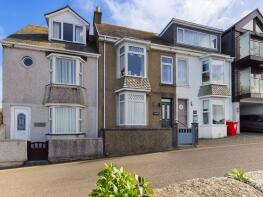
| Today | See what it's worth now |
| 15 Jul 2022 | £590,000 |
No other historical records.
Golden Sands, Clodgy View, St Ives TR26 1JG

| Today | See what it's worth now |
| 17 Jun 2022 | £460,000 |
| 28 Apr 2021 | £100,000 |
Marchbourne, Clodgy View, St. Ives TR26 1JG

| Today | See what it's worth now |
| 25 May 2022 | £735,000 |
| 19 Aug 2016 | £395,000 |
North Light, Clodgy View, St. Ives TR26 1JG

| Today | See what it's worth now |
| 4 Aug 2020 | £480,000 |
| 30 Jul 2010 | £249,950 |
2, Clodgy View, St. Ives TR26 1JG
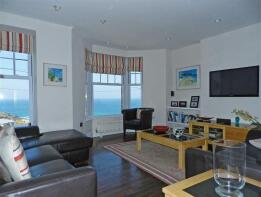
| Today | See what it's worth now |
| 2 Oct 2017 | £490,000 |
| 4 Apr 1997 | £89,000 |
No other historical records.
Sunset View, Clodgy View, St. Ives TR26 1JG

| Today | See what it's worth now |
| 17 Dec 2014 | £319,000 |
No other historical records.
Victoria House, Clodgy View, St. Ives TR26 1JG

| Today | See what it's worth now |
| 18 Jun 2014 | £405,000 |
No other historical records.
6, Clodgy View, St. Ives TR26 1JG

| Today | See what it's worth now |
| 6 Mar 2014 | £605,000 |
| 14 Jun 2005 | £375,000 |
No other historical records.
8, Clodgy View, St. Ives TR26 1JG
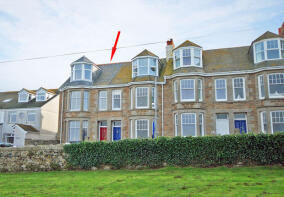
| Today | See what it's worth now |
| 31 Jan 2013 | £700,000 |
| 17 Dec 2004 | £470,000 |
No other historical records.
Sound Of Surf, Clodgy View, St. Ives TR26 1JG

| Today | See what it's worth now |
| 30 Nov 2012 | £250,000 |
| 8 Nov 2007 | £278,000 |
No other historical records.
Barnoon Studio, Clodgy View, St Ives TR26 1JG

| Today | See what it's worth now |
| 7 Oct 2011 | £297,000 |
| 3 Nov 2008 | £135,000 |
2a, Clodgy View, St. Ives TR26 1JG

| Today | See what it's worth now |
| 19 Aug 2011 | £238,000 |
| 1 Oct 2006 | £235,000 |
No other historical records.
Sea Crest, Clodgy View, St. Ives TR26 1JG

| Today | See what it's worth now |
| 20 Aug 2010 | £340,000 |
No other historical records.
Trerice, Clodgy View, St. Ives TR26 1JG

| Today | See what it's worth now |
| 30 Jul 2010 | £225,000 |
| 31 Jan 1997 | £56,500 |
No other historical records.
Flat 1, Rough Seas, Clodgy View, St Ives TR26 1JG

| Today | See what it's worth now |
| 14 Mar 2008 | £455,900 |
No other historical records.
5, Clodgy View, St. Ives TR26 1JG
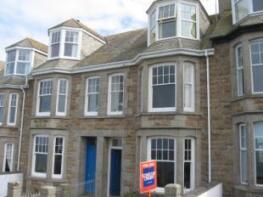
| Today | See what it's worth now |
| 8 Jan 2007 | £410,000 |
No other historical records.
4, Clodgy View, St. Ives TR26 1JG

| Today | See what it's worth now |
| 31 May 2006 | £438,000 |
| 19 Jul 2001 | £235,000 |
First Floor Flat 2, 3, Clodgy View, St Ives TR26 1JG

| Today | See what it's worth now |
| 11 Aug 2004 | £245,000 |
| 26 Jun 2002 | £155,000 |
No other historical records.
3, Clodgy View, St. Ives TR26 1JG
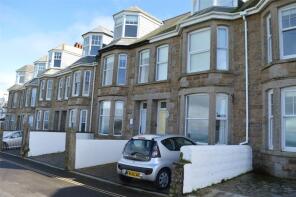
| Today | See what it's worth now |
| 30 Apr 1998 | £126,000 |
| 7 Feb 1997 | £55,500 |
No other historical records.
Tonnow An Mor, Clodgy View, St. Ives TR26 1JG

| Today | See what it's worth now |
| 31 May 1995 | £70,000 |
No other historical records.
Manzanita, Clodgy View, St. Ives TR26 1JG

| Today | See what it's worth now |
| 31 Mar 1995 | £50,000 |
No other historical records.
Find out how much your property is worth
The following agents can provide you with a free, no-obligation valuation. Simply select the ones you'd like to hear from.
Sponsored
All featured agents have paid a fee to promote their valuation expertise.

Yopa
Midlands, South West & Wales

Cross Estates
St. Ives

Bradleys
St Ives

Miller Countrywide
St Ives

Purplebricks
covering Truro
Get ready with a Mortgage in Principle
- Personalised result in just 20 minutes
- Find out how much you can borrow
- Get viewings faster with agents
- No impact on your credit score
Source Acknowledgement: © Crown copyright. England and Wales house price data is publicly available information produced by the HM Land Registry.This material was last updated on 2 December 2025. It covers the period from 1 January 1995 to 31 October 2025 and contains property transactions which have been registered during that period. Contains HM Land Registry data © Crown copyright and database right 2026. This data is licensed under the Open Government Licence v3.0.
Disclaimer: Rightmove.co.uk provides this HM Land Registry data "as is". The burden for fitness of the data relies completely with the user and is provided for informational purposes only. No warranty, express or implied, is given relating to the accuracy of content of the HM Land Registry data and Rightmove does not accept any liability for error or omission. If you have found an error with the data or need further information please contact HM Land Registry.
Permitted Use: Viewers of this Information are granted permission to access this Crown copyright material and to download it onto electronic, magnetic, optical or similar storage media provided that such activities are for private research, study or in-house use only. Any other use of the material requires the formal written permission of Land Registry which can be requested from us, and is subject to an additional licence and associated charge.
Data on planning applications, home extensions and build costs is provided by Resi.co.uk. Planning data is calculated using the last 2 years of residential applications within the selected planning authority. Home extension data, such as build costs and project timelines, are calculated using approximately 9,000 architectural projects Resi has completed, and 23,500 builders quotes submitted via Resi's platform. Build costs are adjusted according to inflation rates to more accurately represent today's prices.
Map data ©OpenStreetMap contributors.
Rightmove takes no liability for your use of, or reliance on, Rightmove's Instant Valuation due to the limitations of our tracking tool listed here. Use of this tool is taken entirely at your own risk. All rights reserved.

