
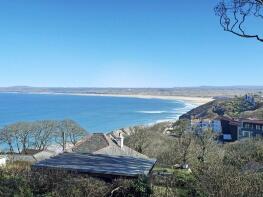
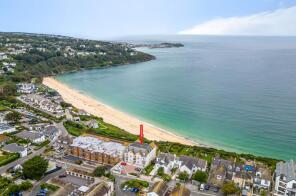
House Prices in TR26
House prices in TR26 have an overall average of £435,007 over the last year.
The majority of properties sold in TR26 during the last year were terraced properties, selling for an average price of £329,241. Detached properties sold for an average of £687,294, with flats fetching £317,732.
Overall, the historical sold prices in TR26 over the last year were 9% down on the previous year and 13% down on the 2023 peak of £498,997.
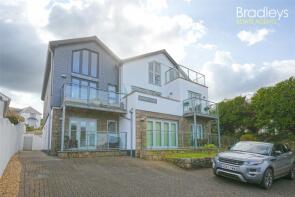
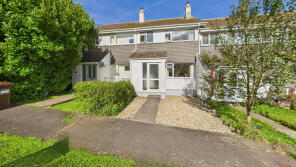
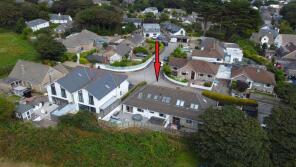
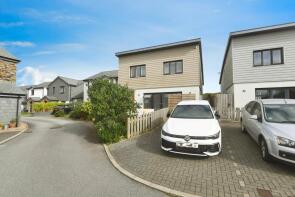
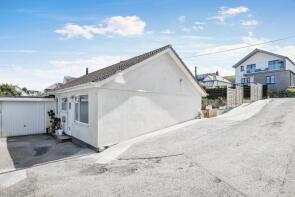
Properties Sold
3, Fernhill Apartments, St Ives Road, St. Ives TR26 2JT
| Today | See what it's worth now |
| 17 Apr 2026 | £230,000 |
| 25 Jan 2010 | £199,500 |
No other historical records.
1, Sandy Lane Apartments, Boskerris Road, St. Ives TR26 2NQ
| Today | See what it's worth now |
| 17 Apr 2026 | £285,000 |
| 10 Apr 2013 | £300,000 |
No other historical records.
Meneth Gwyns, Consols, St Ives TR26 2HW
| Today | See what it's worth now |
| 2 Apr 2026 | £209,000 |
No other historical records.
Extensions and planning permission in TR26
See planning approval stats, extension build costs and value added estimates.

2a, Bay Villa, St Ives Road, St. Ives TR26 2SX

| Today | See what it's worth now |
| 2 Apr 2026 | £320,000 |
| 13 Jun 2022 | £245,000 |
No other historical records.
Flat 1, Chy Rosewarne, The Wharf, St. Ives TR26 1PU
| Today | See what it's worth now |
| 2 Apr 2026 | £280,000 |
| 12 Oct 2005 | £260,000 |
2a, Westcotts Court, Westcotts Quay, St. Ives TR26 2DZ
| Today | See what it's worth now |
| 2 Apr 2026 | £325,000 |
| 14 Dec 2001 | £155,000 |
8, Gill An Creet, St. Ives TR26 2EW
| Today | See what it's worth now |
| 1 Apr 2026 | £262,500 |
| 25 Jun 2015 | £185,000 |
2 Menydh House, The Terrace, St. Ives TR26 2BL
| Today | See what it's worth now |
| 31 Mar 2026 | £700,000 |
| 21 Feb 2018 | £387,500 |
No other historical records.
Trenoweth, St Ives Road, Carbis Bay, Lelant TR26 3ET

| Today | See what it's worth now |
| 27 Mar 2026 | £525,000 |
| 19 Oct 2010 | £311,000 |
4, Cornwallis, Headland Road, St. Ives TR26 2RD
| Today | See what it's worth now |
| 27 Mar 2026 | £505,000 |
| 30 Jun 2004 | £335,000 |
No other historical records.
217, Treva Croft, St Ives Holiday Village, Lelant TR26 3HX
| Today | See what it's worth now |
| 27 Mar 2026 | £58,000 |
No other historical records.
1b, Chyandour Close, St. Ives TR26 2HL
| Today | See what it's worth now |
| 26 Mar 2026 | £428,000 |
| 23 Aug 2001 | £99,950 |
No other historical records.
Rose Glen, Carthew Way, St. Ives TR26 1RJ

| Today | See what it's worth now |
| 26 Mar 2026 | £653,000 |
| 31 Oct 2000 | £190,500 |
No other historical records.
16, The Carracks, St. Ives TR26 3AJ
| Today | See what it's worth now |
| 26 Mar 2026 | £375,000 |
| 30 Jun 2017 | £323,000 |
No other historical records.
12a, Heatherbell Gardens, Longstone Hill, St. Ives TR26 2LJ
| Today | See what it's worth now |
| 24 Mar 2026 | £150,000 |
| 17 Jun 1998 | £35,300 |
No other historical records.
1 Fairweather, Penbeagle Way, St. Ives TR26 2JQ
| Today | See what it's worth now |
| 23 Mar 2026 | £302,000 |
| 26 May 2021 | £292,000 |
7, Road Between Halsetown Road And Laity Lane, Halsetown TR26 3NA
| Today | See what it's worth now |
| 20 Mar 2026 | £275,000 |
No other historical records.
25, Hendras Court, Hendras Parc, St. Ives TR26 2TU
| Today | See what it's worth now |
| 17 Mar 2026 | £287,500 |
| 18 Nov 2016 | £238,000 |
22, The Sands, Porthrepta Road, Carbis Bay TR26 2FG

| Today | See what it's worth now |
| 16 Mar 2026 | £55,000 |
No other historical records.
48 Porthgwel, Back Road East, St. Ives TR26 1PF
| Today | See what it's worth now |
| 12 Mar 2026 | £590,000 |
| 3 Nov 2003 | £317,500 |
No other historical records.
6, Island Road, St. Ives TR26 1NT
| Today | See what it's worth now |
| 12 Mar 2026 | £427,500 |
| 27 Mar 1998 | £79,000 |
No other historical records.
Beach Lodge, Higher Boskerris, St. Ives TR26 2TL
| Today | See what it's worth now |
| 5 Mar 2026 | £127,000 |
| 23 May 2022 | £225,000 |
2, The Sands, Porthrepta Road, St. Ives TR26 2FG
| Today | See what it's worth now |
| 5 Mar 2026 | £408,000 |
| 16 Mar 2009 | £300,000 |
No other historical records.
Source Acknowledgement: © Crown copyright. England and Wales house price data is publicly available information produced by the HM Land Registry.This material was last updated on 9 July 2026. It covers the period from 1 January 1995 to 30 April 2026 and contains property transactions which have been registered during that period. Contains HM Land Registry data © Crown copyright and database right 2026. This data is licensed under the Open Government Licence v3.0.
Disclaimer: Rightmove.co.uk provides this HM Land Registry data "as is". The burden for fitness of the data relies completely with the user and is provided for informational purposes only. No warranty, express or implied, is given relating to the accuracy of content of the HM Land Registry data and Rightmove does not accept any liability for error or omission. If you have found an error with the data or need further information please contact HM Land Registry.
Permitted Use: Viewers of this Information are granted permission to access this Crown copyright material and to download it onto electronic, magnetic, optical or similar storage media provided that such activities are for private research, study or in-house use only. Any other use of the material requires the formal written permission of Land Registry which can be requested from us, and is subject to an additional licence and associated charge.
Rightmove takes no liability for your use of, or reliance on, Rightmove's Instant Valuation due to the limitations of our tracking tool listed here. Use of this tool is taken entirely at your own risk. All rights reserved.