
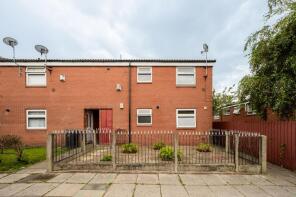
House Prices in Tanhouse
House prices in Tanhouse have an overall average of £181,525 over the last year.
The majority of properties sold in Tanhouse during the last year were semi-detached properties, selling for an average price of £182,389. Terraced properties sold for an average of £123,840, with detached properties fetching £272,477.
Overall, the historical sold prices in Tanhouse over the last year were 5% up on the previous year and 8% up on the 2023 peak of £167,795.
Properties Sold
73, Foxfold, Skelmersdale WN8 6UE
| Today | See what it's worth now |
| 10 Apr 2026 | £75,000 |
| 23 Jan 2004 | £90,000 |
17, Hobberley Drive, Tanhouse, Skelmersdale WN8 6DJ
| Today | See what it's worth now |
| 30 Mar 2026 | £185,000 |
| 9 Jul 2004 | £116,500 |
No other historical records.
22, Rowan Lane, Skelmersdale WN8 6UL
| Today | See what it's worth now |
| 27 Mar 2026 | £430,000 |
| 31 Aug 2016 | £255,000 |
11, Hansby Close, Tanhouse, Skelmersdale WN8 6BL
| Today | See what it's worth now |
| 27 Mar 2026 | £338,000 |
| 26 Jun 2002 | £100,995 |
No other historical records.
107, Egerton, Tanhouse, Skelmersdale WN8 6AA
| Today | See what it's worth now |
| 26 Mar 2026 | £84,500 |
| 15 Mar 2006 | £75,000 |
26, Ferndale, Birch Green, Skelmersdale WN8 6QZ
| Today | See what it's worth now |
| 20 Mar 2026 | £120,000 |
| 10 Dec 2014 | £60,000 |
14, Feltons, Birch Green, Skelmersdale WN8 6RP

| Today | See what it's worth now |
| 6 Mar 2026 | £92,000 |
No other historical records.
12, Eavesdale, Tanhouse, Skelmersdale WN8 6AU
| Today | See what it's worth now |
| 6 Mar 2026 | £210,000 |
| 24 Nov 2000 | £58,000 |
No other historical records.
33, Luddington Drive, Skelmersdale WN8 6HF
| Today | See what it's worth now |
| 6 Mar 2026 | £165,000 |
| 6 Dec 2019 | £110,995 |
No other historical records.
53, Findon Way, Skelmersdale WN8 6HG
| Today | See what it's worth now |
| 5 Mar 2026 | £205,000 |
| 8 Apr 2021 | £165,995 |
No other historical records.
7, Inchfield, Birch Green, Skelmersdale WN8 6LP

| Today | See what it's worth now |
| 2 Mar 2026 | £225,000 |
| 8 Oct 2003 | £92,500 |
No other historical records.
2, Newstead Drive, Skelmersdale WN8 6PT
| Today | See what it's worth now |
| 27 Feb 2026 | £230,000 |
| 9 Sep 1998 | £56,950 |
No other historical records.
10, Newburn Close, Skelmersdale WN8 6PJ
| Today | See what it's worth now |
| 23 Feb 2026 | £220,000 |
| 3 Jul 2015 | £132,000 |
159, Foxfold, Skelmersdale WN8 6UE

| Today | See what it's worth now |
| 20 Feb 2026 | £190,000 |
| 15 Jun 2005 | £80,000 |
No other historical records.
8, Meadowclough, Skelmersdale WN8 6QW
| Today | See what it's worth now |
| 19 Feb 2026 | £215,000 |
| 5 Nov 1999 | £59,500 |
16, Leeswood, Skelmersdale WN8 6TH
| Today | See what it's worth now |
| 16 Feb 2026 | £169,000 |
| 4 Feb 2005 | £91,783 |
No other historical records.
42, Felstead, Birch Green, Skelmersdale WN8 6QX
| Today | See what it's worth now |
| 12 Feb 2026 | £165,000 |
| 25 Sep 2009 | £110,000 |
No other historical records.
24, Briars Green, Skelmersdale WN8 6SQ
| Today | See what it's worth now |
| 10 Feb 2026 | £260,000 |
| 31 Jul 2003 | £150,000 |
No other historical records.
10d, Willow Walk, Skelmersdale WN8 6UR
| Today | See what it's worth now |
| 6 Feb 2026 | £130,000 |
| 22 Aug 2014 | £81,000 |
111, Lindens, Skelmersdale WN8 6TJ
| Today | See what it's worth now |
| 27 Jan 2026 | £80,000 |
No other historical records.
44, Inglewhite, Birch Green, Skelmersdale WN8 6JE

| Today | See what it's worth now |
| 23 Jan 2026 | £132,000 |
| 15 Nov 2019 | £102,000 |
8, Kestrel Park, Ashurst, Skelmersdale WN8 6TB
| Today | See what it's worth now |
| 5 Jan 2026 | £250,000 |
| 24 Feb 2006 | £145,000 |
No other historical records.
135, Lindens, Skelmersdale WN8 6TJ
| Today | See what it's worth now |
| 19 Dec 2025 | £57,500 |
| 29 Apr 2016 | £53,000 |
Source Acknowledgement: © Crown copyright. England and Wales house price data is publicly available information produced by the HM Land Registry.This material was last updated on 9 July 2026. It covers the period from 1 January 1995 to 30 April 2026 and contains property transactions which have been registered during that period. Contains HM Land Registry data © Crown copyright and database right 2026. This data is licensed under the Open Government Licence v3.0.
Disclaimer: Rightmove.co.uk provides this HM Land Registry data "as is". The burden for fitness of the data relies completely with the user and is provided for informational purposes only. No warranty, express or implied, is given relating to the accuracy of content of the HM Land Registry data and Rightmove does not accept any liability for error or omission. If you have found an error with the data or need further information please contact HM Land Registry.
Permitted Use: Viewers of this Information are granted permission to access this Crown copyright material and to download it onto electronic, magnetic, optical or similar storage media provided that such activities are for private research, study or in-house use only. Any other use of the material requires the formal written permission of Land Registry which can be requested from us, and is subject to an additional licence and associated charge.
Rightmove takes no liability for your use of, or reliance on, Rightmove's Instant Valuation due to the limitations of our tracking tool listed here. Use of this tool is taken entirely at your own risk. All rights reserved.