
House Prices in Throop
House prices in Throop have an overall average of £366,969 over the last year.
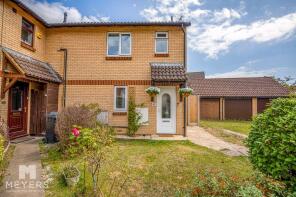
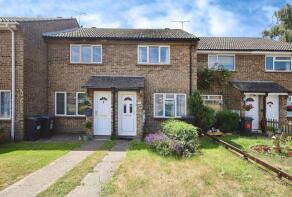
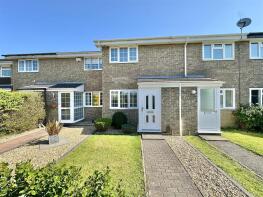
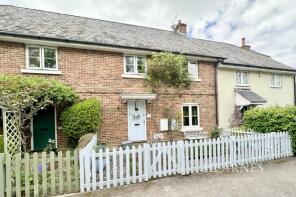
The majority of properties sold in Throop during the last year were terraced properties, selling for an average price of £296,619. Detached properties sold for an average of £551,833, with semi-detached properties fetching £352,292.
Overall, the historical sold prices in Throop over the last year were 3% down on the previous year and 2% up on the 2022 peak of £358,578.
Properties Sold
45, Bradford Road, Bournemouth BH9 3PJ
| Today | See what it's worth now |
| 5 Dec 2025 | £273,000 |
| 28 Jul 2022 | £295,000 |
15, Bramshaw Gardens, Bournemouth BH8 0BT
| Today | See what it's worth now |
| 5 Dec 2025 | £252,000 |
No other historical records.
31, Tytherley Green, Bournemouth BH8 0PA
| Today | See what it's worth now |
| 4 Dec 2025 | £210,000 |
| 13 Dec 2023 | £175,000 |
1 Lavender Cottage, Lavender Road, Bournemouth BH8 0PX
| Today | See what it's worth now |
| 2 Dec 2025 | £575,000 |
| 17 Nov 2017 | £420,000 |
47, Shawford Road, Bournemouth BH8 0PF
| Today | See what it's worth now |
| 28 Nov 2025 | £295,000 |
| 27 May 2022 | £290,000 |
32, Fritham Gardens, Bournemouth BH8 0EL
| Today | See what it's worth now |
| 21 Nov 2025 | £260,000 |
| 31 Jul 2003 | £138,000 |
21, Calmore Close, Bournemouth BH8 0NN
| Today | See what it's worth now |
| 14 Nov 2025 | £291,000 |
| 27 May 2016 | £222,500 |
65, Fawley Green, Bournemouth BH8 0EU

| Today | See what it's worth now |
| 7 Nov 2025 | £270,000 |
| 14 Apr 2021 | £257,500 |
8, Taylor Drive, Bournemouth BH8 0PZ
| Today | See what it's worth now |
| 7 Nov 2025 | £435,000 |
| 23 Nov 2020 | £424,500 |
6, Larksfield Avenue, Bournemouth BH9 3LP
| Today | See what it's worth now |
| 7 Nov 2025 | £325,000 |
| 14 Jun 2024 | £315,000 |
No other historical records.
21, Horton Close, Bournemouth BH9 3PH
| Today | See what it's worth now |
| 31 Oct 2025 | £295,000 |
| 11 Dec 2019 | £250,000 |
No other historical records.
16, Cadnam Way, Bournemouth BH8 0PL
| Today | See what it's worth now |
| 31 Oct 2025 | £350,000 |
| 23 Nov 2015 | £257,500 |
No other historical records.
7, Sandford Close, Bournemouth BH9 3PQ
| Today | See what it's worth now |
| 17 Oct 2025 | £315,000 |
| 4 Sep 2006 | £212,250 |
No other historical records.
270, Castle Lane West, Bournemouth BH8 9TU
| Today | See what it's worth now |
| 17 Oct 2025 | £650,000 |
| 5 Jun 2006 | £345,000 |
3, Chesilbourne Grove, Bournemouth BH8 0BA
| Today | See what it's worth now |
| 2 Oct 2025 | £495,000 |
| 18 Jun 2021 | £420,000 |
14, Damerham Road, Bournemouth BH8 0BU
| Today | See what it's worth now |
| 26 Sep 2025 | £385,000 |
| 17 Mar 2003 | £183,000 |
4, Stratton Road, Bournemouth BH9 3PG

| Today | See what it's worth now |
| 25 Sep 2025 | £340,000 |
| 19 Feb 2018 | £295,000 |
1, Cherry Tree Lodge, Castle Lane West, Bournemouth BH8 9TG
| Today | See what it's worth now |
| 22 Sep 2025 | £176,000 |
No other historical records.
25, Barrowgate Way, Bournemouth BH8 0HD
| Today | See what it's worth now |
| 22 Sep 2025 | £370,000 |
| 10 Feb 2005 | £192,000 |
42, Gunville Crescent, Bournemouth BH9 3QA
| Today | See what it's worth now |
| 19 Sep 2025 | £300,000 |
| 26 Oct 2020 | £245,000 |
69, Chesildene Avenue, Bournemouth BH8 0AZ
| Today | See what it's worth now |
| 18 Sep 2025 | £455,000 |
| 8 Nov 2010 | £222,500 |
1, Calmore Close, Bournemouth BH8 0NN
| Today | See what it's worth now |
| 12 Sep 2025 | £320,000 |
| 9 Dec 2004 | £180,000 |
20, Ampfield Road, Bournemouth BH8 0ET
| Today | See what it's worth now |
| 12 Sep 2025 | £355,000 |
| 23 Feb 2012 | £192,500 |
10, Diamond Place, Bournemouth BH8 0FA

| Today | See what it's worth now |
| 11 Sep 2025 | £570,000 |
| 17 Apr 2015 | £367,995 |
No other historical records.
55, Braishfield Gardens, Bournemouth BH8 0QA
| Today | See what it's worth now |
| 4 Sep 2025 | £370,000 |
| 4 Apr 1997 | £69,000 |
No other historical records.
Source Acknowledgement: © Crown copyright. England and Wales house price data is publicly available information produced by the HM Land Registry.This material was last updated on 4 February 2026. It covers the period from 1 January 1995 to 24 December 2025 and contains property transactions which have been registered during that period. Contains HM Land Registry data © Crown copyright and database right 2026. This data is licensed under the Open Government Licence v3.0.
Disclaimer: Rightmove.co.uk provides this HM Land Registry data "as is". The burden for fitness of the data relies completely with the user and is provided for informational purposes only. No warranty, express or implied, is given relating to the accuracy of content of the HM Land Registry data and Rightmove does not accept any liability for error or omission. If you have found an error with the data or need further information please contact HM Land Registry.
Permitted Use: Viewers of this Information are granted permission to access this Crown copyright material and to download it onto electronic, magnetic, optical or similar storage media provided that such activities are for private research, study or in-house use only. Any other use of the material requires the formal written permission of Land Registry which can be requested from us, and is subject to an additional licence and associated charge.
Map data ©OpenStreetMap contributors.
Rightmove takes no liability for your use of, or reliance on, Rightmove's Instant Valuation due to the limitations of our tracking tool listed here. Use of this tool is taken entirely at your own risk. All rights reserved.