
House Prices in Queens Park
House prices in Queens Park have an overall average of £1,066,615 over the last year.
The majority of properties sold in Queens Park during the last year were flats, selling for an average price of £608,268. Terraced properties sold for an average of £1,746,129, with semi-detached properties fetching £2,452,857.
Overall, the historical sold prices in Queens Park over the last year were 3% up on the previous year and 4% down on the 2022 peak of £1,110,195.
Properties Sold
24e, Brondesbury Road, London NW6 6AY

| Today | See today's value |
| 18 Aug 2026 | £610,000 |
| 27 Sep 2021 | £1,026,750 |
4, Peploe Road, London NW6 6EB
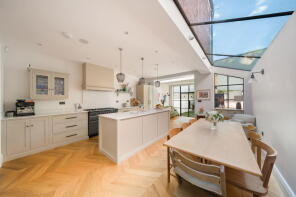
| Today | See today's value |
| 13 Aug 2026 | £2,292,500 |
| 18 Apr 2018 | £1,235,000 |
No other historical records.
West Lodge, Willesden Lane, Kilburn, London NW6 7SD
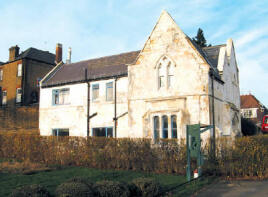
| Today | See today's value |
| 10 Aug 2026 | £1,560,000 |
No other historical records.
104, Christchurch Avenue, London NW6 7PE
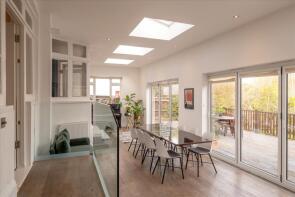
| Today | See today's value |
| 10 Aug 2026 | £3,902,500 |
| 11 May 2015 | £3,400,000 |
41, Linden Avenue, London NW10 5QT
| Today | See today's value |
| 7 Aug 2026 | £1,900,000 |
| 31 Jan 2014 | £1,250,000 |
95b, Kilburn Lane, North Kensington, London W10 4AN
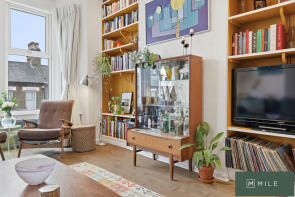
| Today | See today's value |
| 7 Aug 2026 | £550,000 |
| 9 Aug 2013 | £425,000 |
10, 1 Birchside Apartments, Albert Road, London NW6 5FS
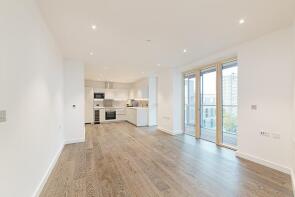
| Today | See today's value |
| 30 Jul 2026 | £670,000 |
| 28 Sep 2016 | £704,450 |
No other historical records.
27a, Hazelmere Road, London NW6 7HA
| Today | See today's value |
| 29 Jul 2026 | £460,000 |
No other historical records.
49a, Brondesbury Villas, London NW6 6AJ
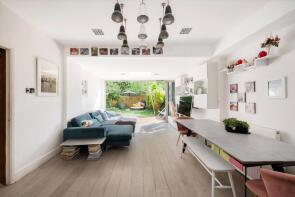
| Today | See today's value |
| 27 Jul 2026 | £820,000 |
| 1 Jun 2010 | £460,000 |
Ground Floor Flat, 23, Donaldson Road, London NW6 6NE

| Today | See today's value |
| 24 Jul 2026 | £835,000 |
| 20 Jun 2014 | £785,000 |
52, 1 13 Mapes House, Winchester Avenue, Kilburn, London NW6 7TR
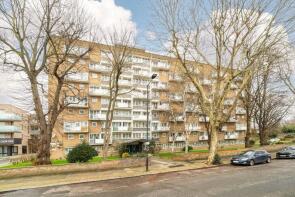
| Today | See today's value |
| 24 Jul 2026 | £355,000 |
| 31 Oct 2017 | £385,000 |
No other historical records.
16, Crediton Road, London NW10 3DU
| Today | See today's value |
| 24 Jul 2026 | £3,000,000 |
| 19 Feb 2015 | £1,590,000 |
No other historical records.
3, Summerfield Avenue, London NW6 6JT
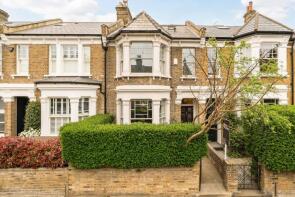
| Today | See today's value |
| 22 Jul 2026 | £2,200,000 |
| 20 Mar 2002 | £515,000 |
43a 43b, Chamberlayne Road, London NW10 3NB

| Today | See today's value |
| 20 Jul 2026 | £363,000 |
| 24 Jun 2022 | £500,000 |
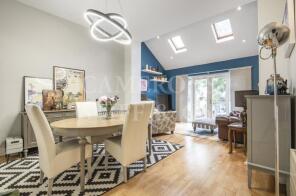
124a, Brondesbury Road, London NW6 6SB
| Today | See today's value |
| 17 Jul 2026 | £417,250 |
| 26 Aug 2022 | £715,000 |
63a, Harvist Road, London NW6 6EX

| Today | See today's value |
| 14 Jul 2026 | £770,000 |
| 1 Feb 2005 | £335,000 |
16a, College Parade, Salusbury Road, London NW6 6RN
| Today | See today's value |
| 10 Jul 2026 | £320,000 |
| 12 Dec 2012 | £330,000 |
18, Dowland Street, London W10 4UA
| Today | See today's value |
| 10 Jul 2026 | £450,000 |
| 23 Sep 2005 | £225,000 |
No other historical records.
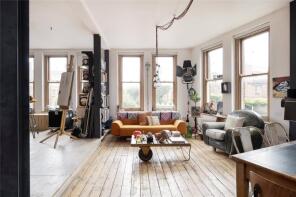
4, College Mansions, Winchester Avenue, Kilburn, London NW6 7TY
| Today | See today's value |
| 10 Jul 2026 | £885,000 |
| 17 Aug 2001 | £220,000 |
No other historical records.
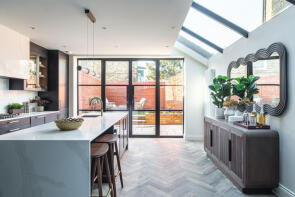
36, Linden Avenue, London NW10 5RL
| Today | See today's value |
| 9 Jul 2026 | £1,660,000 |
No other historical records.
119, Harvist Road, London NW6 6HA

| Today | See today's value |
| 8 Jul 2026 | £760,000 |
| 22 Nov 2024 | £1,330,000 |
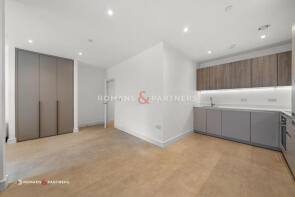
Flat 5, 9 Dalton Lodge, The Avenue, London NW6 7YG
| Today | See today's value |
| 8 Jul 2026 | £740,000 |
| 1 Aug 2023 | £636,500 |
Flat 17, 34 Academy Court, Glengall Road, London NW6 7FB

| Today | See today's value |
| 1 Jul 2026 | £675,000 |
| 30 Apr 2009 | £384,950 |
No other historical records.

Rightmove takes no liability for your use of, or reliance on, Rightmove's Instant Valuation due to the limitations of our tracking tool listed here. Use of this tool is taken entirely at your own risk. All rights reserved.