
House Prices in Tolvaddon Downs
House prices in Tolvaddon Downs have an overall average of £309,514 over the last year.
The majority of properties sold in Tolvaddon Downs during the last year were terraced properties, selling for an average price of £229,125. Detached properties sold for an average of £406,432, with semi-detached properties fetching £304,300.
Overall, the historical sold prices in Tolvaddon Downs over the last year were 8% up on the previous year and 3% up on the 2023 peak of £301,329.
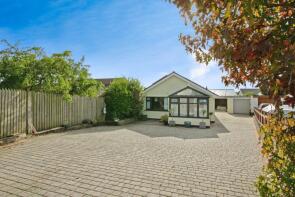
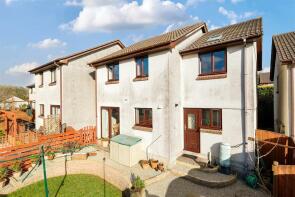
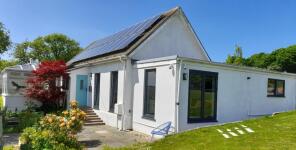
Properties Sold
6, Tehidy Close, Camborne TR14 0HL
| Today | See what it's worth now |
| 27 Apr 2026 | £370,000 |
| 12 Sep 2003 | £205,000 |
Tremayne Cottage, Mount Whistle Road, Camborne TR14 0HU
| Today | See what it's worth now |
| 15 Apr 2026 | £465,000 |
| 1 Aug 2014 | £330,000 |
No other historical records.
Puggis Farm, Reskadinnick, Camborne TR14 0BH
| Today | See what it's worth now |
| 15 Apr 2026 | £750,000 |
| 8 Aug 2019 | £540,000 |
No other historical records.
25, Fore Street, Barripper TR14 0QR
| Today | See what it's worth now |
| 13 Apr 2026 | £215,000 |
No other historical records.
1b, Treswithian Barns, Access Road From Treswithian, Camborne TR14 7NN
| Today | See what it's worth now |
| 27 Mar 2026 | £460,000 |
| 16 Aug 2006 | £380,000 |
No other historical records.
23, Trethannas Gardens, Camborne TR14 0LL

| Today | See what it's worth now |
| 23 Mar 2026 | £345,000 |
| 30 Jun 2017 | £240,000 |
2, North Roskear Village, Camborne TR14 0AS
| Today | See what it's worth now |
| 16 Mar 2026 | £160,000 |
| 18 Aug 2015 | £113,000 |
48, Chivilas Road, Camborne TR14 0FG
| Today | See what it's worth now |
| 13 Mar 2026 | £100,000 |
| 4 Jan 2021 | £76,000 |
No other historical records.
South Villa, Tehidy Park, Camborne TR14 0TH
| Today | See what it's worth now |
| 6 Mar 2026 | £540,000 |
| 15 Feb 2021 | £495,000 |
Sunny Vista, Mount Whistle Road, Camborne TR14 0HU

| Today | See what it's worth now |
| 6 Mar 2026 | £250,000 |
| 9 Aug 1999 | £88,250 |
No other historical records.
2 Mancroft, Ramsgate, Camborne TR14 0RQ
| Today | See what it's worth now |
| 20 Feb 2026 | £300,000 |
| 2 Nov 2018 | £215,000 |
No other historical records.
18, Penvale Close, Camborne TR14 0QP
| Today | See what it's worth now |
| 6 Feb 2026 | £340,000 |
| 18 Dec 1996 | £58,000 |
No other historical records.
3, Primrose Close, Camborne TR14 7HS
| Today | See what it's worth now |
| 6 Feb 2026 | £159,250 |
| 17 Feb 1997 | £65,000 |
No other historical records.
Sunny Brow, Merry Meeting, Camborne TR14 0DS
| Today | See what it's worth now |
| 30 Jan 2026 | £430,000 |
| 28 Apr 2022 | £380,000 |
47, Sefton House, Vyvyans Court, Camborne TR14 8PF
| Today | See what it's worth now |
| 19 Dec 2025 | £128,000 |
| 13 Jul 2006 | £118,500 |
No other historical records.
24, Willow Drive, Camborne TR14 7HR
| Today | See what it's worth now |
| 17 Dec 2025 | £415,000 |
| 31 Oct 2003 | £215,000 |
No other historical records.
15, Penvale Close, Camborne TR14 0QP
| Today | See what it's worth now |
| 16 Dec 2025 | £330,000 |
| 19 Jul 2012 | £225,000 |
86, Fore Street, Camborne TR14 0JU
| Today | See what it's worth now |
| 15 Dec 2025 | £205,000 |
| 7 Jun 2000 | £57,500 |
Reskadinnick Cottage, Reskadinnick, Camborne TR14 0BH
| Today | See what it's worth now |
| 12 Dec 2025 | £590,000 |
| 2 Sep 2022 | £400,000 |
No other historical records.
12, Springfield Park, Camborne TR14 0QZ
| Today | See what it's worth now |
| 5 Dec 2025 | £325,000 |
| 30 Sep 2021 | £300,000 |
8, Springfield Park, Camborne TR14 0QZ
| Today | See what it's worth now |
| 20 Nov 2025 | £307,000 |
| 27 Apr 2007 | £227,000 |
54, Chivilas Road, Camborne TR14 0FG
| Today | See what it's worth now |
| 17 Nov 2025 | £112,500 |
No other historical records.
8, Penhale Road, Camborne TR14 0GD
| Today | See what it's worth now |
| 14 Nov 2025 | £160,000 |
| 21 Aug 2024 | £160,000 |
No other historical records.

Source Acknowledgement: © Crown copyright. England and Wales house price data is publicly available information produced by the HM Land Registry.This material was last updated on 9 July 2026. It covers the period from 1 January 1995 to 30 April 2026 and contains property transactions which have been registered during that period. Contains HM Land Registry data © Crown copyright and database right 2026. This data is licensed under the Open Government Licence v3.0.
Disclaimer: Rightmove.co.uk provides this HM Land Registry data "as is". The burden for fitness of the data relies completely with the user and is provided for informational purposes only. No warranty, express or implied, is given relating to the accuracy of content of the HM Land Registry data and Rightmove does not accept any liability for error or omission. If you have found an error with the data or need further information please contact HM Land Registry.
Permitted Use: Viewers of this Information are granted permission to access this Crown copyright material and to download it onto electronic, magnetic, optical or similar storage media provided that such activities are for private research, study or in-house use only. Any other use of the material requires the formal written permission of Land Registry which can be requested from us, and is subject to an additional licence and associated charge.
Rightmove takes no liability for your use of, or reliance on, Rightmove's Instant Valuation due to the limitations of our tracking tool listed here. Use of this tool is taken entirely at your own risk. All rights reserved.