
House Prices in Tonypandy
House prices in Tonypandy have an overall average of £142,961 over the last year.
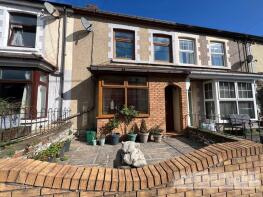
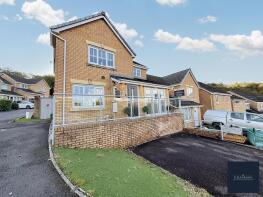
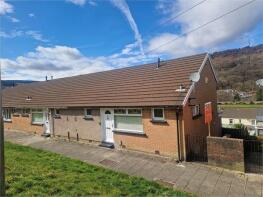
The majority of properties sold in Tonypandy during the last year were terraced properties, selling for an average price of £130,739. Detached properties sold for an average of £245,222, with semi-detached properties fetching £200,431.
Overall, the historical sold prices in Tonypandy over the last year were 10% up on the previous year and 13% up on the 2022 peak of £126,007.
Properties Sold
11, Marjorie Street, Trealaw, Tonypandy CF40 2PQ
| Today | See what it's worth now |
| 21 Apr 2026 | £166,500 |
| 12 Apr 2019 | £105,000 |
8, Cwrt Gellifaelog, Tonypandy CF40 1DX
| Today | See what it's worth now |
| 10 Apr 2026 | £337,000 |
| 20 Jun 2011 | £156,995 |
No other historical records.
5, Argyle Terrace, Llwynypia, Tonypandy CF40 2JA
| Today | See what it's worth now |
| 31 Mar 2026 | £137,000 |
| 25 Oct 2017 | £46,450 |
No other historical records.
21, Buckley Road, Trealaw, Tonypandy CF40 2LW
| Today | See what it's worth now |
| 27 Mar 2026 | £135,000 |
| 8 Jan 2021 | £79,995 |
106, Parc Gellifaelog, Tonypandy CF40 1DU
| Today | See what it's worth now |
| 27 Mar 2026 | £275,000 |
| 16 Jun 2006 | £230,000 |
No other historical records.
6, Office Row, Penrhiw-fer, Tonypandy CF40 1SQ
| Today | See what it's worth now |
| 26 Mar 2026 | £98,000 |
| 14 Nov 2019 | £50,000 |
No other historical records.
1, Cae Mawr Cottages, Penrhiwfer Road, Penrhiw-fer, Tonypandy CF40 1RR
| Today | See what it's worth now |
| 11 Mar 2026 | £70,000 |
| 17 Aug 2009 | £90,000 |
No other historical records.
25, Penmaesglas Terrace, Pen-y-graig, Tonypandy CF40 1EB

| Today | See what it's worth now |
| 9 Mar 2026 | £159,950 |
No other historical records.
1, Cross Row, Pen-y-graig, Tonypandy CF40 1HD
| Today | See what it's worth now |
| 9 Mar 2026 | £118,000 |
| 30 Mar 2004 | £55,000 |
4, Gilmour Street, Tonypandy CF40 2LB

| Today | See what it's worth now |
| 6 Mar 2026 | £80,000 |
| 31 Aug 2001 | £34,950 |
4, Thomas Street, Pen-y-graig, Tonypandy CF40 1EU
| Today | See what it's worth now |
| 27 Feb 2026 | £99,000 |
| 12 Nov 2018 | £80,000 |
10, Blaenlau Street, Pen-y-graig, Tonypandy CF40 1LN

| Today | See what it's worth now |
| 27 Feb 2026 | £170,000 |
| 16 Jun 2023 | £125,000 |
47, Trealaw Road, Trealaw, Tonypandy CF40 2NS
| Today | See what it's worth now |
| 27 Feb 2026 | £149,000 |
| 20 Feb 2015 | £60,500 |
5, Ar Y Bryn Court, Greenfield Street, Pen-y-graig, Tonypandy CF40 1PN
| Today | See what it's worth now |
| 20 Feb 2026 | £315,000 |
| 16 Nov 2020 | £270,000 |
No other historical records.
41, Llanfair Road, Pen-y-graig, Tonypandy CF40 1TA

| Today | See what it's worth now |
| 20 Feb 2026 | £185,000 |
| 19 Apr 2013 | £65,000 |
No other historical records.
1, Parc Afon, Dinas, Tonypandy CF40 1JP
| Today | See what it's worth now |
| 19 Feb 2026 | £262,000 |
| 2 Oct 1998 | £92,000 |
No other historical records.
5, Ynyscynon Road, Trealaw, Tonypandy CF40 2LN
| Today | See what it's worth now |
| 19 Feb 2026 | £100,000 |
No other historical records.
8, Clydach Road, Clydach, Tonypandy CF40 2BD

| Today | See what it's worth now |
| 13 Feb 2026 | £90,000 |
| 16 Jun 2023 | £76,000 |
11, Court Street, Tonypandy CF40 2RQ

| Today | See what it's worth now |
| 13 Feb 2026 | £194,000 |
| 18 Mar 2021 | £120,000 |
16, Caroline Street, Williamstown, Tonypandy CF40 1PB

| Today | See what it's worth now |
| 6 Feb 2026 | £133,000 |
| 30 Apr 2004 | £61,000 |
52, Partridge Road, Llwynypia, Tonypandy CF40 2LR
| Today | See what it's worth now |
| 5 Feb 2026 | £88,000 |
No other historical records.
54, Aubrey Road, Pen-y-graig, Tonypandy CF40 1TG
| Today | See what it's worth now |
| 30 Jan 2026 | £125,000 |
| 22 Jun 2022 | £86,500 |
236, Rhys Street, Trealaw, Tonypandy CF40 2PX
| Today | See what it's worth now |
| 30 Jan 2026 | £140,000 |
| 14 Jul 2004 | £66,000 |


Source Acknowledgement: © Crown copyright. England and Wales house price data is publicly available information produced by the HM Land Registry.This material was last updated on 9 July 2026. It covers the period from 1 January 1995 to 30 April 2026 and contains property transactions which have been registered during that period. Contains HM Land Registry data © Crown copyright and database right 2026. This data is licensed under the Open Government Licence v3.0.
Disclaimer: Rightmove.co.uk provides this HM Land Registry data "as is". The burden for fitness of the data relies completely with the user and is provided for informational purposes only. No warranty, express or implied, is given relating to the accuracy of content of the HM Land Registry data and Rightmove does not accept any liability for error or omission. If you have found an error with the data or need further information please contact HM Land Registry.
Permitted Use: Viewers of this Information are granted permission to access this Crown copyright material and to download it onto electronic, magnetic, optical or similar storage media provided that such activities are for private research, study or in-house use only. Any other use of the material requires the formal written permission of Land Registry which can be requested from us, and is subject to an additional licence and associated charge.
Rightmove takes no liability for your use of, or reliance on, Rightmove's Instant Valuation due to the limitations of our tracking tool listed here. Use of this tool is taken entirely at your own risk. All rights reserved.