
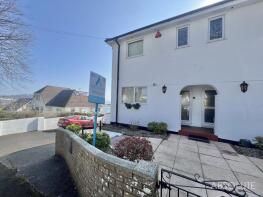
House Prices in Torbay
House prices in Torbay have an overall average of £274,741 over the last year.
The majority of properties sold in Torbay during the last year were terraced properties, selling for an average price of £227,091. Detached properties sold for an average of £428,100, with semi-detached properties fetching £280,205.
Overall, the historical sold prices in Torbay over the last year were 4% down on the previous year and 6% down on the 2023 peak of £292,610.
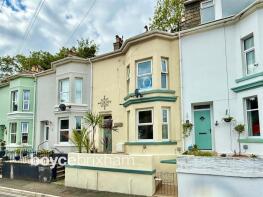
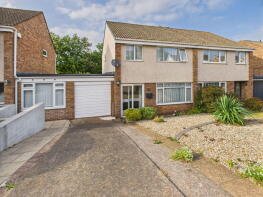
Properties Sold
2, Ashburn Walk, Paignton TQ4 7LX
| Today | See what it's worth now |
| 27 Mar 2026 | £277,500 |
| 18 Dec 2019 | £240,000 |
59, Chestnut Drive, Brixham TQ5 0DE
| Today | See what it's worth now |
| 27 Mar 2026 | £275,000 |
| 12 Apr 2024 | £205,000 |
5, St Marys Drive, Brixham TQ5 9FB

| Today | See what it's worth now |
| 25 Mar 2026 | £260,000 |
| 21 Jul 2015 | £187,500 |
89, Milton Street, Brixham TQ5 0AR
| Today | See what it's worth now |
| 24 Mar 2026 | £292,500 |
| 9 Dec 2020 | £209,500 |
17, Hill Park Terrace, Paignton TQ4 6EX
| Today | See what it's worth now |
| 23 Mar 2026 | £192,000 |
| 6 Jan 2006 | £145,000 |
77, Harbourne Avenue, Paignton TQ4 7EQ
| Today | See what it's worth now |
| 20 Mar 2026 | £275,000 |
| 3 Feb 1995 | £53,000 |
No other historical records.
46, All Hallows Road, Preston, Paignton TQ3 1EB

| Today | See what it's worth now |
| 20 Mar 2026 | £290,000 |
| 27 Jul 2018 | £214,820 |
Flat 2, 15 Brent Court, Brent Road, Paignton TQ3 3AR
| Today | See what it's worth now |
| 20 Mar 2026 | £160,000 |
| 29 Oct 1999 | £137,000 |
164, Forest Road, Torquay TQ1 4JZ
| Today | See what it's worth now |
| 20 Mar 2026 | £425,000 |
| 20 Jul 2012 | £149,950 |
No other historical records.
24, Tor Close, Paignton TQ4 6LB
| Today | See what it's worth now |
| 20 Mar 2026 | £378,000 |
No other historical records.
65, Sturcombe Avenue, Paignton TQ4 7TD
| Today | See what it's worth now |
| 18 Mar 2026 | £157,000 |
| 16 Dec 2015 | £120,000 |
Flat 2, 12 Broadpark Court, Broadpark Road, Torquay TQ2 6TB
| Today | See what it's worth now |
| 18 Mar 2026 | £237,500 |
| 25 Sep 2009 | £237,500 |
Cuckmere, Dashpers, Brixham TQ5 9LJ

| Today | See what it's worth now |
| 17 Mar 2026 | £122,010 |
| 13 Jun 2024 | £242,000 |
11, Glenmore Road, Brixham TQ5 9BT
| Today | See what it's worth now |
| 17 Mar 2026 | £245,000 |
| 24 Mar 2016 | £137,500 |
Flat 1, West View, Ashfield Gardens (path B), Torquay TQ2 6HQ
| Today | See what it's worth now |
| 16 Mar 2026 | £260,000 |
| 30 Oct 2015 | £223,000 |
205, Roselands Drive, Paignton TQ4 7RN
| Today | See what it's worth now |
| 16 Mar 2026 | £260,000 |
No other historical records.
1, Heritage Way, Brixham TQ5 9FN
| Today | See what it's worth now |
| 13 Mar 2026 | £485,000 |
| 11 Nov 2020 | £375,000 |
24, Albany Court, Polsham Park, Paignton TQ3 2BB
| Today | See what it's worth now |
| 13 Mar 2026 | £94,000 |
| 28 Apr 2015 | £92,500 |
9, Winner Street, Paignton TQ3 3BN

| Today | See what it's worth now |
| 13 Mar 2026 | £130,000 |
| 29 Dec 1995 | £36,500 |
No other historical records.
Flat 1, Edwinstowe, Higher Warberry Road, Wellswood, Torquay TQ1 1SF
| Today | See what it's worth now |
| 13 Mar 2026 | £275,000 |
| 26 Jun 2020 | £220,000 |
Flat 34, Clarendon Court, Stitchill Road, Wellswood, Torquay TQ1 1QA
| Today | See what it's worth now |
| 13 Mar 2026 | £84,000 |
No other historical records.
7, Oystercatcher Court, Steep Hill, Maidencombe, Torquay TQ1 4TS
| Today | See what it's worth now |
| 11 Mar 2026 | £230,000 |
| 24 Jan 2022 | £240,000 |
No other historical records.
16a, Hillesdon Road, Torquay TQ1 1QQ
| Today | See what it's worth now |
| 11 Mar 2026 | £70,000 |
| 6 May 2016 | £74,000 |
Source Acknowledgement: © Crown copyright. England and Wales house price data is publicly available information produced by the HM Land Registry.This material was last updated on 15 May 2026. It covers the period from 1 January 1995 to 31 March 2026 and contains property transactions which have been registered during that period. Contains HM Land Registry data © Crown copyright and database right 2026. This data is licensed under the Open Government Licence v3.0.
Disclaimer: Rightmove.co.uk provides this HM Land Registry data "as is". The burden for fitness of the data relies completely with the user and is provided for informational purposes only. No warranty, express or implied, is given relating to the accuracy of content of the HM Land Registry data and Rightmove does not accept any liability for error or omission. If you have found an error with the data or need further information please contact HM Land Registry.
Permitted Use: Viewers of this Information are granted permission to access this Crown copyright material and to download it onto electronic, magnetic, optical or similar storage media provided that such activities are for private research, study or in-house use only. Any other use of the material requires the formal written permission of Land Registry which can be requested from us, and is subject to an additional licence and associated charge.
Rightmove takes no liability for your use of, or reliance on, Rightmove's Instant Valuation due to the limitations of our tracking tool listed here. Use of this tool is taken entirely at your own risk. All rights reserved.