
House Prices in Upper Basildon
House prices in Upper Basildon have an overall average of £600,750 over the last year.
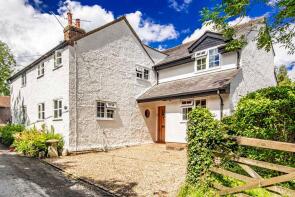
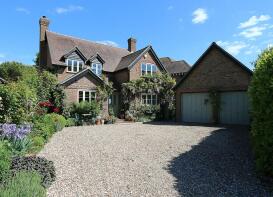
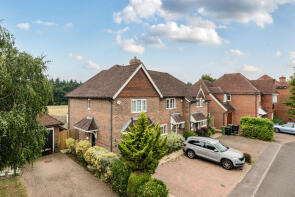
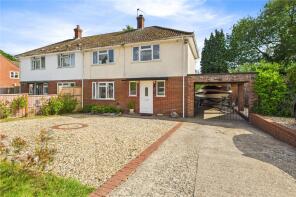
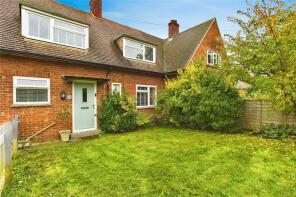
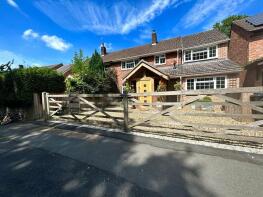
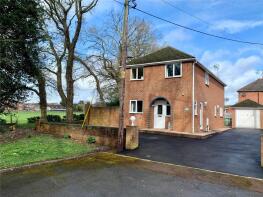
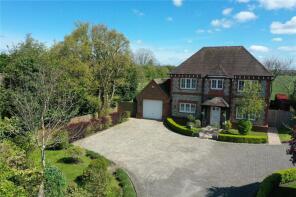
The majority of properties sold in Upper Basildon during the last year were detached properties, selling for an average price of £661,250. Semi-detached properties sold for an average of £625,625, with terraced properties fetching £430,000.
Overall, the historical sold prices in Upper Basildon over the last year were 35% down on the previous year and 43% down on the 2019 peak of £1,051,250.
Properties Sold
8, Beckfords, Upper Basildon, Reading RG8 8PB
| Today | See what it's worth now |
| 11 Feb 2026 | £725,000 |
| 11 Aug 2000 | £165,000 |
No other historical records.
Foxhill Cottage, Mead Lane, Upper Basildon, Reading RG8 8LS
| Today | See what it's worth now |
| 1 Dec 2025 | £910,000 |
| 27 Oct 2020 | £880,000 |
9, Morrison Close, Upper Basildon, Reading RG8 8LL
| Today | See what it's worth now |
| 24 Nov 2025 | £400,000 |
| 12 Jan 2017 | £375,000 |
35, Wakemans, Upper Basildon, Reading RG8 8JE
| Today | See what it's worth now |
| 13 Oct 2025 | £422,500 |
| 6 Mar 2020 | £330,000 |
4, Morrison Close, Upper Basildon, Reading RG8 8LL
| Today | See what it's worth now |
| 29 Aug 2025 | £635,000 |
| 27 Jan 2006 | £225,000 |
No other historical records.
5, Tenaplas Drive, Upper Basildon, Reading RG8 8SS


| Today | See what it's worth now |
| 17 Jun 2025 | £720,000 |
| 26 Apr 2012 | £170,000 |
No other historical records.
38, Wakemans, Upper Basildon, Reading RG8 8JE
| Today | See what it's worth now |
| 6 Jun 2025 | £480,000 |
| 18 Apr 2018 | £400,000 |
1, Honeycroft Cottages, Pangbourne Road, Upper Basildon, Reading RG8 8LR

| Today | See what it's worth now |
| 30 Apr 2025 | £665,000 |
| 24 May 2006 | £424,000 |
43, Wakemans, Upper Basildon, Reading RG8 8JE

| Today | See what it's worth now |
| 25 Apr 2025 | £460,000 |
| 19 Oct 2012 | £290,000 |
Redwood, Emery Acres, Upper Basildon, Reading RG8 8NY
| Today | See what it's worth now |
| 11 Apr 2025 | £590,000 |
| 10 Dec 1998 | £185,000 |
No other historical records.
10, Tenaplas Drive, Upper Basildon, Reading RG8 8SS
| Today | See what it's worth now |
| 31 Mar 2025 | £415,000 |
No other historical records.
Willow Dene, Bethesda Street, Upper Basildon, Reading RG8 8NT

| Today | See what it's worth now |
| 28 Mar 2025 | £1,250,000 |
| 13 Jan 2004 | £632,500 |
Upstream, Aldworth Road, Upper Basildon, Reading RG8 8NG

| Today | See what it's worth now |
| 28 Mar 2025 | £1,250,000 |
| 1 Sep 2017 | £940,000 |
11, Tenaplas Drive, Upper Basildon, Reading RG8 8SS
| Today | See what it's worth now |
| 27 Mar 2025 | £503,000 |
| 6 Oct 2017 | £280,000 |
No other historical records.
South Croft, Pangbourne Road, Upper Basildon, Reading RG8 8LN
| Today | See what it's worth now |
| 26 Mar 2025 | £1,175,000 |
No other historical records.
Graysted, Unnamed Road From Beckfords To Pangbourne Road, Upper Basildon, Reading RG8 8LU
| Today | See what it's worth now |
| 26 Mar 2025 | £635,000 |
| 12 Dec 2019 | £650,000 |
9, Tenaplas Drive, Upper Basildon, Reading RG8 8SS
| Today | See what it's worth now |
| 7 Mar 2025 | £525,000 |
| 21 Oct 2019 | £450,000 |
7, Captains Gorse, Upper Basildon, Reading RG8 8SZ

| Today | See what it's worth now |
| 21 Feb 2025 | £905,000 |
| 17 Aug 1999 | £348,500 |
No other historical records.
63, Wakemans, Upper Basildon, Reading RG8 8JE
| Today | See what it's worth now |
| 18 Feb 2025 | £340,000 |
| 22 Mar 2019 | £275,000 |
1, Knappswood Close, Upper Basildon, Reading RG8 8LQ

| Today | See what it's worth now |
| 7 Feb 2025 | £1,450,000 |
| 17 Sep 2008 | £975,000 |
6, Tenaplas Drive, Upper Basildon, Reading RG8 8SS
| Today | See what it's worth now |
| 10 Jan 2025 | £640,000 |
| 13 Jan 2014 | £155,000 |
No other historical records.
29a, Wakemans, Upper Basildon, Reading RG8 8JE
| Today | See what it's worth now |
| 8 Jan 2025 | £525,500 |
No other historical records.
Flint House, Blandys Lane, Upper Basildon, Reading RG8 8LY
| Today | See what it's worth now |
| 12 Dec 2024 | £1,200,000 |
| 8 Nov 2012 | £825,000 |
No other historical records.
The Cedars, Bethesda Street, Upper Basildon, Reading RG8 8NU
| Today | See what it's worth now |
| 5 Dec 2024 | £1,475,000 |
| 25 Sep 2009 | £1,000,000 |
20a, Tenaplas Drive, Upper Basildon, Reading RG8 8SS
| Today | See what it's worth now |
| 6 Nov 2024 | £155,000 |
| 6 Nov 2013 | £180,000 |
No other historical records.
Source Acknowledgement: © Crown copyright. England and Wales house price data is publicly available information produced by the HM Land Registry.This material was last updated on 9 April 2026. It covers the period from 1 January 1995 to 27 February 2026 and contains property transactions which have been registered during that period. Contains HM Land Registry data © Crown copyright and database right 2026. This data is licensed under the Open Government Licence v3.0.
Disclaimer: Rightmove.co.uk provides this HM Land Registry data "as is". The burden for fitness of the data relies completely with the user and is provided for informational purposes only. No warranty, express or implied, is given relating to the accuracy of content of the HM Land Registry data and Rightmove does not accept any liability for error or omission. If you have found an error with the data or need further information please contact HM Land Registry.
Permitted Use: Viewers of this Information are granted permission to access this Crown copyright material and to download it onto electronic, magnetic, optical or similar storage media provided that such activities are for private research, study or in-house use only. Any other use of the material requires the formal written permission of Land Registry which can be requested from us, and is subject to an additional licence and associated charge.
Map data ©OpenStreetMap contributors.
Rightmove takes no liability for your use of, or reliance on, Rightmove's Instant Valuation due to the limitations of our tracking tool listed here. Use of this tool is taken entirely at your own risk. All rights reserved.