
House Prices in Upperton
House prices in Upperton have an overall average of £296,292 over the last year.
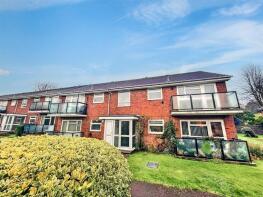
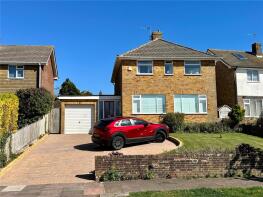
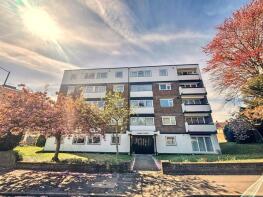
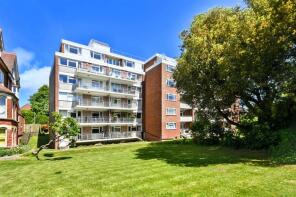
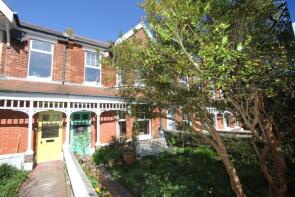
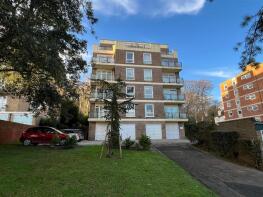
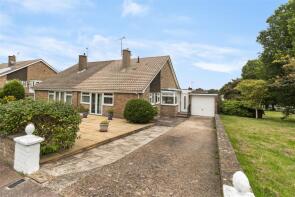
The majority of properties sold in Upperton during the last year were flats, selling for an average price of £188,085. Detached properties sold for an average of £494,366, with terraced properties fetching £342,152.
Overall, the historical sold prices in Upperton over the last year were 10% down on the previous year and 6% down on the 2023 peak of £313,785.
Properties Sold
31, Bradford Street, Eastbourne BN21 1HZ
| Today | See what it's worth now |
| 23 Apr 2026 | £290,000 |
| 9 Aug 2010 | £184,950 |
No other historical records.
6, Beverington Close, Eastbourne BN21 2SB
| Today | See what it's worth now |
| 10 Apr 2026 | £470,000 |
| 16 Feb 2021 | £410,000 |
37, Church Street, Eastbourne BN21 1HN

| Today | See what it's worth now |
| 4 Apr 2026 | £180,000 |
| 30 Jan 2008 | £100,000 |
No other historical records.
5, Monceux Road, Eastbourne BN21 1RD
| Today | See what it's worth now |
| 2 Apr 2026 | £312,500 |
| 13 Sep 2013 | £180,000 |
Flat 30, Lovell Court, Mill Road, Eastbourne BN21 2LW
| Today | See what it's worth now |
| 31 Mar 2026 | £137,500 |
| 23 Dec 1998 | £32,500 |
No other historical records.
Flat 23, 14 Eversley Court, St Annes Road, Eastbourne BN21 2BS

| Today | See what it's worth now |
| 27 Mar 2026 | £246,000 |
| 12 Dec 2006 | £199,950 |
15, Shortdean Place, Eastbourne BN21 1SA
| Today | See what it's worth now |
| 27 Mar 2026 | £189,950 |
| 5 Apr 2007 | £156,000 |
No other historical records.
32, Cobbold Avenue, Eastbourne BN21 1UZ
| Today | See what it's worth now |
| 27 Mar 2026 | £525,000 |
| 13 Mar 2018 | £417,000 |
Flat 3, 26, Upperton Gardens, Eastbourne BN21 2AH
| Today | See what it's worth now |
| 27 Mar 2026 | £155,000 |
| 20 Dec 2017 | £133,000 |
Flat 9, 1 Carew Court, Carew Road, Eastbourne BN21 2AT
| Today | See what it's worth now |
| 26 Mar 2026 | £205,000 |
| 12 Feb 2009 | £169,950 |
No other historical records.
Flat 40, Marlborough Court, Southfields Road, Eastbourne BN21 1BT
| Today | See what it's worth now |
| 25 Mar 2026 | £250,000 |
| 19 Nov 2019 | £265,000 |
Flat 4, 2 Rowington House, Lewes Road, Eastbourne BN21 2BZ
| Today | See what it's worth now |
| 25 Mar 2026 | £115,000 |
| 26 Jan 2018 | £118,000 |
Flat 2, 8 Bramber House, Michel Grove, Eastbourne BN21 1LA
| Today | See what it's worth now |
| 23 Mar 2026 | £220,000 |
| 28 Oct 2021 | £191,000 |
255, Kings Drive, Eastbourne BN21 2UR
| Today | See what it's worth now |
| 20 Mar 2026 | £650,000 |
| 30 Jun 2021 | £617,500 |
Flat 3, 8, Hurst Road, Eastbourne BN21 2PL
| Today | See what it's worth now |
| 17 Mar 2026 | £80,000 |
| 4 Apr 2018 | £82,000 |
36, Willingdon Road, Eastbourne BN21 1TJ
| Today | See what it's worth now |
| 13 Mar 2026 | £342,000 |
| 24 Feb 2006 | £190,000 |
Flat 1, 10 Kingswood House, Lewes Road, Eastbourne BN21 2BX
| Today | See what it's worth now |
| 6 Mar 2026 | £80,000 |
| 24 Mar 2000 | £45,000 |
No other historical records.
13, Motcombe Road, Eastbourne BN21 1PU
| Today | See what it's worth now |
| 6 Mar 2026 | £269,950 |
| 3 May 2022 | £225,000 |
21, Lawns Avenue, Eastbourne BN21 1PJ
| Today | See what it's worth now |
| 5 Mar 2026 | £415,000 |
| 24 Apr 2009 | £248,950 |
2, Baldwin Avenue, Eastbourne BN21 1UJ
| Today | See what it's worth now |
| 5 Mar 2026 | £620,000 |
| 19 Apr 2007 | £372,100 |
No other historical records.
Flat 26, 29 Selwyn House, Selwyn Road, Eastbourne BN21 2LF
| Today | See what it's worth now |
| 5 Mar 2026 | £148,500 |
| 7 Oct 2013 | £104,000 |
34, Mill Road, Eastbourne BN21 2PG
| Today | See what it's worth now |
| 27 Feb 2026 | £445,000 |
| 20 Jul 2007 | £320,000 |
Flat 2, 5 Elmwood, Arundel Road, Eastbourne BN21 2EN
| Today | See what it's worth now |
| 27 Feb 2026 | £144,000 |
| 24 Jan 2017 | £148,500 |
Source Acknowledgement: © Crown copyright. England and Wales house price data is publicly available information produced by the HM Land Registry.This material was last updated on 9 July 2026. It covers the period from 1 January 1995 to 30 April 2026 and contains property transactions which have been registered during that period. Contains HM Land Registry data © Crown copyright and database right 2026. This data is licensed under the Open Government Licence v3.0.
Disclaimer: Rightmove.co.uk provides this HM Land Registry data "as is". The burden for fitness of the data relies completely with the user and is provided for informational purposes only. No warranty, express or implied, is given relating to the accuracy of content of the HM Land Registry data and Rightmove does not accept any liability for error or omission. If you have found an error with the data or need further information please contact HM Land Registry.
Permitted Use: Viewers of this Information are granted permission to access this Crown copyright material and to download it onto electronic, magnetic, optical or similar storage media provided that such activities are for private research, study or in-house use only. Any other use of the material requires the formal written permission of Land Registry which can be requested from us, and is subject to an additional licence and associated charge.
Rightmove takes no liability for your use of, or reliance on, Rightmove's Instant Valuation due to the limitations of our tracking tool listed here. Use of this tool is taken entirely at your own risk. All rights reserved.