
House Prices in Uxbridge
House prices in Uxbridge have an overall average of £541,543 over the last year.
The majority of properties sold in Uxbridge during the last year were semi-detached properties, selling for an average price of £589,016. Flats sold for an average of £282,786, with terraced properties fetching £487,950.
Overall, the historical sold prices in Uxbridge over the last year were 1% up on the previous year and 4% up on the 2022 peak of £518,730.
Properties Sold
19, Press Road, Uxbridge UB8 1AT

| Today | See today's value |
| 21 Aug 2026 | £345,000 |
| 15 Jul 1999 | £90,000 |
No other historical records.
55, Glisson Road, Uxbridge UB10 0HJ
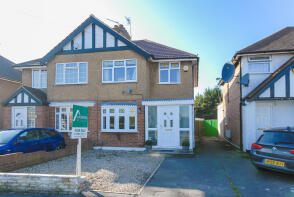
| Today | See today's value |
| 18 Aug 2026 | £450,000 |
| 15 Nov 2019 | £435,000 |
75, Cedars Drive, Uxbridge UB10 0QY
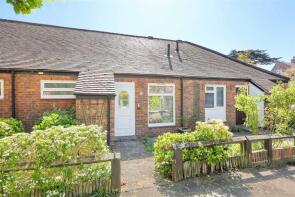
| Today | See today's value |
| 14 Aug 2026 | £340,000 |
| 30 Oct 2000 | £107,000 |
No other historical records.
66, Halford Road, Uxbridge UB10 8QA
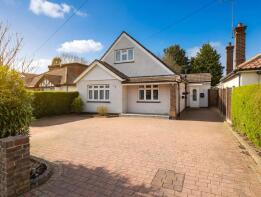
| Today | See today's value |
| 14 Aug 2026 | £1,010,000 |
| 16 Jan 2014 | £670,000 |
60, Burnham Avenue, Uxbridge UB10 8RT
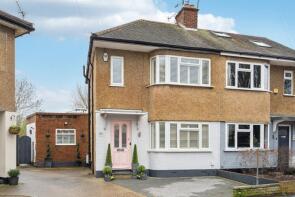
| Today | See today's value |
| 14 Aug 2026 | £740,000 |
| 12 Jul 1999 | £126,000 |
No other historical records.
69, Bridge Road, Uxbridge UB8 2QP
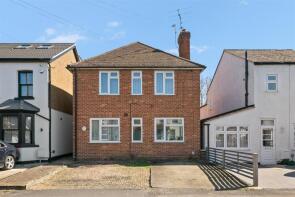
| Today | See today's value |
| 14 Aug 2026 | £349,000 |
| 5 Jun 2018 | £300,000 |
18, Pages Lane, Uxbridge UB8 1XT
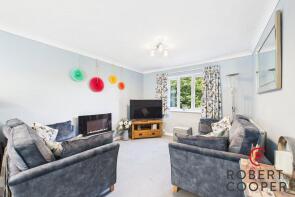
| Today | See today's value |
| 14 Aug 2026 | £277,000 |
| 26 Jul 2013 | £173,500 |
18, Berkeley Road, Uxbridge UB10 9DX
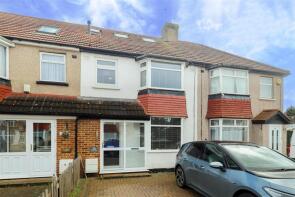
| Today | See today's value |
| 13 Aug 2026 | £575,000 |
| 24 Sep 2020 | £450,000 |
43, Athol Way, Uxbridge UB10 0LE
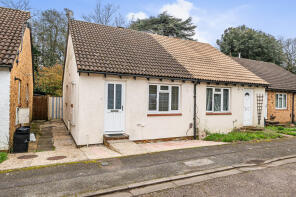
| Today | See today's value |
| 10 Aug 2026 | £350,000 |
| 10 Dec 2014 | £249,900 |
31, Wescott Way, Uxbridge UB8 2RF
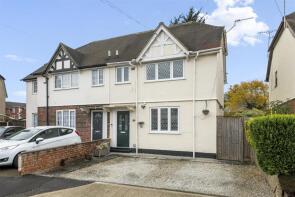
| Today | See today's value |
| 7 Aug 2026 | £500,000 |
| 13 Dec 2019 | £412,000 |
315, Aylsham Drive, Uxbridge UB10 8UJ
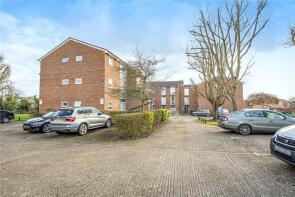
| Today | See today's value |
| 7 Aug 2026 | £305,000 |
| 30 Sep 2021 | £314,000 |
40, Crispin Way, Uxbridge UB8 3WS
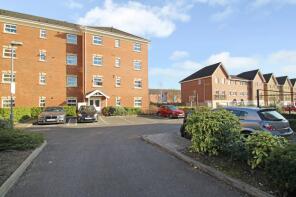
| Today | See today's value |
| 7 Aug 2026 | £274,000 |
| 4 Aug 2006 | £209,500 |
7, Saxon Close, Uxbridge UB8 3RW
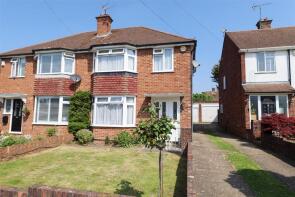
| Today | See today's value |
| 5 Aug 2026 | £550,000 |
| 23 Jul 2012 | £319,750 |
4, Burford Close, Uxbridge UB10 8EH
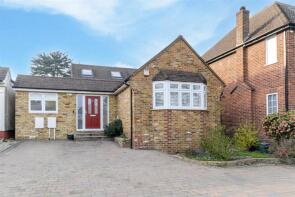
| Today | See today's value |
| 5 Aug 2026 | £875,000 |
| 4 May 2018 | £635,000 |
38, Pole Hill Road, Uxbridge UB10 0QA

| Today | See today's value |
| 5 Aug 2026 | £565,000 |
| 19 May 2003 | £237,000 |
No other historical records.
10, Deblin Drive, Uxbridge UB10 0GF

| Today | See today's value |
| 4 Aug 2026 | £640,000 |
| 29 Feb 2016 | £524,950 |
No other historical records.
45, Nine Elms Avenue, Uxbridge UB8 3TJ
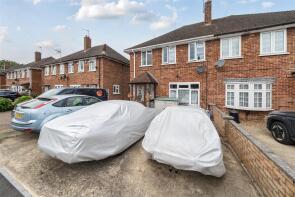
| Today | See today's value |
| 31 Jul 2026 | £499,950 |
| 7 Jul 2000 | £133,500 |
No other historical records.
18, Aldenham Drive, Uxbridge UB8 3UA
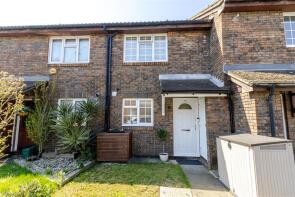
| Today | See today's value |
| 31 Jul 2026 | £400,000 |
| 18 Feb 2020 | £330,000 |
22, Kenbury Close, Uxbridge UB10 8HU
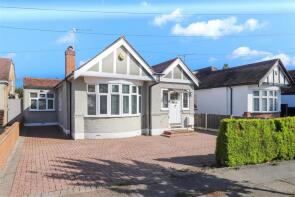
| Today | See today's value |
| 29 Jul 2026 | £690,000 |
| 11 Jun 2021 | £650,000 |
81a, Copthall Road West, Uxbridge UB10 8HS
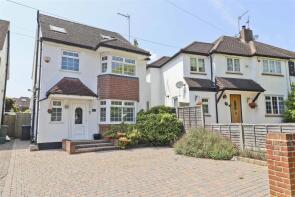
| Today | See today's value |
| 29 Jul 2026 | £835,000 |
| 10 Jul 2023 | £830,000 |
17, Berkeley Road, Uxbridge UB10 9DX
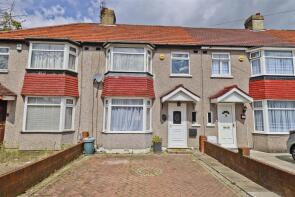
| Today | See today's value |
| 28 Jul 2026 | £500,000 |
| 21 Jun 2021 | £435,000 |
5, Star Court, Star Road, Uxbridge UB10 0QW
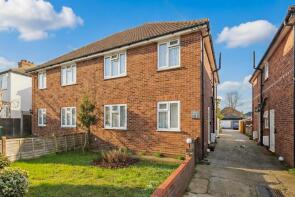
| Today | See today's value |
| 27 Jul 2026 | £335,000 |
| 4 Jan 2023 | £313,000 |
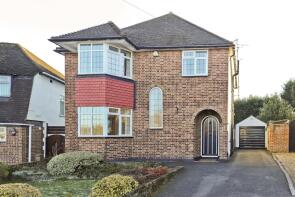
2, Pages Lane, Uxbridge UB8 1XT

| Today | See today's value |
| 24 Jul 2026 | £295,000 |
| 18 Jun 2021 | £312,000 |

Rightmove takes no liability for your use of, or reliance on, Rightmove's Instant Valuation due to the limitations of our tracking tool listed here. Use of this tool is taken entirely at your own risk. All rights reserved.