
House Prices in Walkington
House prices in Walkington have an overall average of £417,615 over the last year.
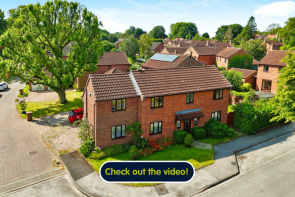
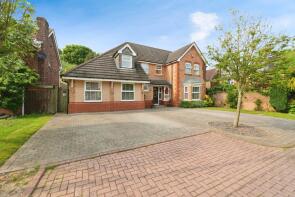
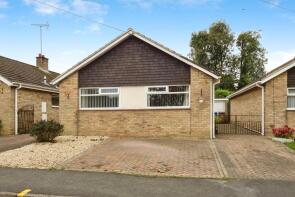
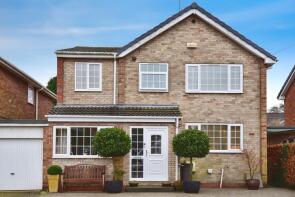
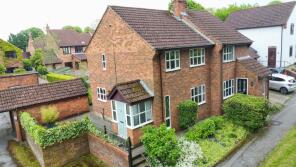
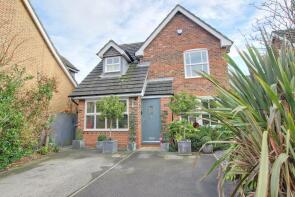
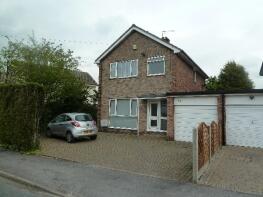
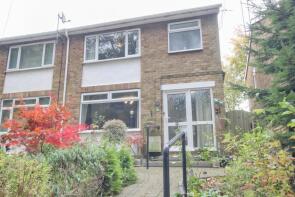
The majority of properties sold in Walkington during the last year were detached properties, selling for an average price of £466,889. Semi-detached properties sold for an average of £326,275, with terraced properties fetching £202,500.
Overall, the historical sold prices in Walkington over the last year were 11% up on the previous year and 5% up on the 2020 peak of £399,152.
Properties Sold
51a Tree Tops, East End, Beverley HU17 8RX
| Today | See what it's worth now |
| 26 Nov 2025 | £755,000 |
| 21 Aug 2020 | £650,000 |
No other historical records.
25 Wolds View, Manor House Lane, Beverley HU17 8SU
| Today | See what it's worth now |
| 18 Nov 2025 | £475,000 |
| 15 Apr 2011 | £280,000 |
Broadacres, Beverley Road, Beverley HU17 8RR
| Today | See what it's worth now |
| 18 Nov 2025 | £725,000 |
| 22 Jun 2006 | £350,000 |
No other historical records.
21, Westfield Garth, Beverley HU17 8TJ
| Today | See what it's worth now |
| 18 Nov 2025 | £445,000 |
| 14 May 2003 | £195,000 |
23a Drumlin House, West End, Beverley HU17 8SX


| Today | See what it's worth now |
| 17 Oct 2025 | £760,000 |
| 12 Nov 2020 | £600,000 |
No other historical records.
34, Crake Wells, Beverley HU17 8SB
| Today | See what it's worth now |
| 5 Sep 2025 | £251,500 |
| 18 Jun 2021 | £190,000 |
8, Huzzard Close, Beverley HU17 8YG
| Today | See what it's worth now |
| 29 Aug 2025 | £235,000 |
| 27 Apr 2015 | £167,000 |
1, All Hallows Road, Beverley HU17 8SH
| Today | See what it's worth now |
| 14 Aug 2025 | £371,600 |
| 20 Oct 2017 | £252,500 |
85, Megson Way, Beverley HU17 8YA

| Today | See what it's worth now |
| 1 Aug 2025 | £275,000 |
| 7 May 2021 | £265,000 |
3, Meadow Way, Beverley HU17 8SD
| Today | See what it's worth now |
| 1 Aug 2025 | £415,000 |
| 12 Aug 2014 | £210,000 |
No other historical records.
38, Lawson Close, Beverley HU17 8TR
| Today | See what it's worth now |
| 28 Jul 2025 | £425,000 |
| 13 Dec 2021 | £455,000 |
29, George Lane, Beverley HU17 8XX
| Today | See what it's worth now |
| 10 Jul 2025 | £490,000 |
| 5 Sep 2002 | £189,950 |
22, Crake Wells, Beverley HU17 8SB
| Today | See what it's worth now |
| 4 Jul 2025 | £262,000 |
| 26 Aug 2021 | £209,500 |
26, All Hallows Road, Beverley HU17 8SJ
| Today | See what it's worth now |
| 13 Jun 2025 | £385,000 |
| 10 May 2010 | £155,000 |
The Barn, Northgate, Walkington HU17 8ST

| Today | See what it's worth now |
| 28 May 2025 | £550,000 |
No other historical records.
9, Redgates, Beverley HU17 8TS
| Today | See what it's worth now |
| 22 May 2025 | £247,500 |
| 8 Aug 2003 | £129,000 |
48, Megson Way, Beverley HU17 8YA
| Today | See what it's worth now |
| 22 May 2025 | £345,000 |
| 6 Oct 2006 | £204,000 |
9, Northgate, Beverley HU17 8ST

| Today | See what it's worth now |
| 20 May 2025 | £170,000 |
| 29 Nov 2011 | £150,000 |
No other historical records.
45, All Hallows Road, Beverley HU17 8SH
| Today | See what it's worth now |
| 7 Apr 2025 | £278,775 |
| 14 Jul 2006 | £190,000 |
18, Northgate, Beverley HU17 8ST
| Today | See what it's worth now |
| 31 Mar 2025 | £246,000 |
| 6 Nov 2015 | £179,950 |
No other historical records.
30, Lawson Close, Beverley HU17 8TR

| Today | See what it's worth now |
| 28 Mar 2025 | £285,000 |
| 23 Oct 2015 | £197,000 |
No other historical records.
1, Apple Tree Yard, Beverley HU17 8GS
| Today | See what it's worth now |
| 27 Mar 2025 | £455,000 |
| 1 Nov 2019 | £415,000 |
No other historical records.
1, Richmond Park, Walkington HU17 8FE

| Today | See what it's worth now |
| 26 Mar 2025 | £750,000 |
No other historical records.
69, All Hallows Road, Walkington HU17 8SH
| Today | See what it's worth now |
| 18 Mar 2025 | £350,000 |
No other historical records.
19, West Mill Rise, Beverley HU17 8TP

| Today | See what it's worth now |
| 14 Mar 2025 | £493,000 |
| 28 Aug 1998 | £140,000 |
No other historical records.
Source Acknowledgement: © Crown copyright. England and Wales house price data is publicly available information produced by the HM Land Registry.This material was last updated on 4 February 2026. It covers the period from 1 January 1995 to 24 December 2025 and contains property transactions which have been registered during that period. Contains HM Land Registry data © Crown copyright and database right 2026. This data is licensed under the Open Government Licence v3.0.
Disclaimer: Rightmove.co.uk provides this HM Land Registry data "as is". The burden for fitness of the data relies completely with the user and is provided for informational purposes only. No warranty, express or implied, is given relating to the accuracy of content of the HM Land Registry data and Rightmove does not accept any liability for error or omission. If you have found an error with the data or need further information please contact HM Land Registry.
Permitted Use: Viewers of this Information are granted permission to access this Crown copyright material and to download it onto electronic, magnetic, optical or similar storage media provided that such activities are for private research, study or in-house use only. Any other use of the material requires the formal written permission of Land Registry which can be requested from us, and is subject to an additional licence and associated charge.
Map data ©OpenStreetMap contributors.
Rightmove takes no liability for your use of, or reliance on, Rightmove's Instant Valuation due to the limitations of our tracking tool listed here. Use of this tool is taken entirely at your own risk. All rights reserved.