
House Prices in Warblington
House prices in Warblington have an overall average of £348,297 over the last year.
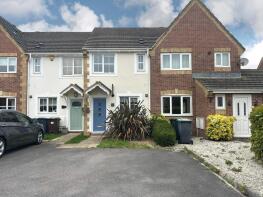
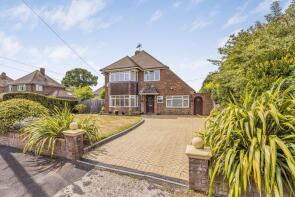
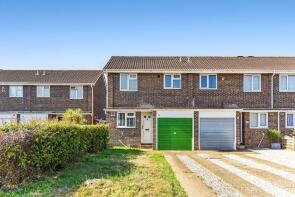
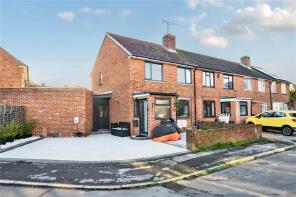
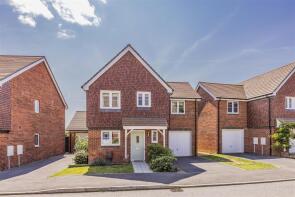
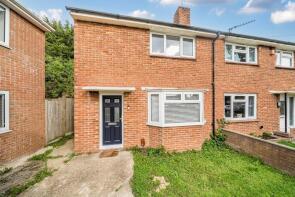
The majority of properties sold in Warblington during the last year were terraced properties, selling for an average price of £276,042. Detached properties sold for an average of £562,920, with semi-detached properties fetching £341,953.
Overall, the historical sold prices in Warblington over the last year were 14% up on the previous year and 7% up on the 2022 peak of £326,094.
Properties Sold
64, Catherington Way, Havant PO9 2BS
| Today | See what it's worth now |
| 24 Apr 2026 | £247,500 |
| 27 Jan 2017 | £167,000 |
No other historical records.
1, Denn Fields, Third Avenue, Havant PO9 2QZ

| Today | See what it's worth now |
| 17 Apr 2026 | £332,500 |
| 1 Oct 2015 | £265,000 |
No other historical records.
49, Monterey Drive, Havant PO9 5TQ

| Today | See what it's worth now |
| 7 Apr 2026 | £295,000 |
| 13 Dec 1996 | £70,950 |
No other historical records.
30, Hamilton Close, Havant PO9 1RP
| Today | See what it's worth now |
| 7 Apr 2026 | £385,000 |
| 1 Mar 2013 | £296,000 |
2, Woodbury Avenue, Havant PO9 1RH
| Today | See what it's worth now |
| 31 Mar 2026 | £467,500 |
| 26 Aug 2016 | £405,000 |
No other historical records.
17, Berkeley Square, Havant PO9 2RT
| Today | See what it's worth now |
| 26 Mar 2026 | £447,500 |
| 20 Sep 1996 | £96,500 |
No other historical records.
8, First Avenue, Havant PO9 2QN
| Today | See what it's worth now |
| 26 Mar 2026 | £770,000 |
| 19 Dec 2013 | £500,000 |
Flat 17, 41 Bellair House, East Street, Havant PO9 1QS
| Today | See what it's worth now |
| 26 Mar 2026 | £86,500 |
| 21 Aug 2015 | £80,000 |
121, Nutwick Road, Havant PO9 2UQ
| Today | See what it's worth now |
| 24 Mar 2026 | £365,000 |
| 21 May 2021 | £325,000 |
Flat 6, 29 Empire Court, East Street, Havant PO9 1EL
| Today | See what it's worth now |
| 20 Mar 2026 | £215,000 |
| 27 Oct 2016 | £140,000 |
No other historical records.
2, Southbrook Close, Havant PO9 1RW

| Today | See what it's worth now |
| 19 Mar 2026 | £690,000 |
| 23 Oct 2014 | £400,251 |
19, Snowberry Crescent, Havant PO9 2FG
| Today | See what it's worth now |
| 19 Mar 2026 | £285,000 |
| 22 Apr 2016 | £185,000 |
11, Springwell, Havant PO9 1EB
| Today | See what it's worth now |
| 19 Mar 2026 | £275,000 |
| 19 Dec 2014 | £249,995 |
1, Northlea, Prince George Street, Havant PO9 1FR
| Today | See what it's worth now |
| 18 Mar 2026 | £134,000 |
| 10 Jul 2020 | £127,000 |
No other historical records.
Flat 14, 26 Wellington Court, Waterloo Road, Havant PO9 1BL

| Today | See what it's worth now |
| 17 Mar 2026 | £160,000 |
| 20 Aug 2021 | £145,000 |
20, Pook Lane, Havant PO9 2TH
| Today | See what it's worth now |
| 13 Mar 2026 | £595,000 |
| 5 Aug 2013 | £385,000 |
No other historical records.
61, Hornbeam Road, Havant PO9 2UR
| Today | See what it's worth now |
| 13 Mar 2026 | £288,000 |
| 18 Mar 2022 | £275,000 |
No other historical records.
21, Adhurst Road, Havant PO9 2HP
| Today | See what it's worth now |
| 9 Mar 2026 | £270,000 |
| 29 Sep 2022 | £250,000 |
No other historical records.
Flat 5, 19 Elmleigh House, Leigh Road, Havant PO9 2ET

| Today | See what it's worth now |
| 6 Mar 2026 | £210,000 |
| 6 Sep 2021 | £215,000 |
23, Normandy Way, Havant PO9 5FH
| Today | See what it's worth now |
| 27 Feb 2026 | £395,000 |
| 2 Oct 2020 | £349,995 |
No other historical records.
22, Luard Court, Havant PO9 2TN

| Today | See what it's worth now |
| 27 Feb 2026 | £302,000 |
No other historical records.
122, St Albans Road, Havant PO9 2LA
| Today | See what it's worth now |
| 27 Feb 2026 | £250,000 |
| 20 Aug 2021 | £199,995 |
No other historical records.
39, Normandy Way, Havant PO9 5FH
| Today | See what it's worth now |
| 26 Feb 2026 | £300,000 |
| 11 Feb 2021 | £270,000 |
No other historical records.
Source Acknowledgement: © Crown copyright. England and Wales house price data is publicly available information produced by the HM Land Registry.This material was last updated on 9 July 2026. It covers the period from 1 January 1995 to 30 April 2026 and contains property transactions which have been registered during that period. Contains HM Land Registry data © Crown copyright and database right 2026. This data is licensed under the Open Government Licence v3.0.
Disclaimer: Rightmove.co.uk provides this HM Land Registry data "as is". The burden for fitness of the data relies completely with the user and is provided for informational purposes only. No warranty, express or implied, is given relating to the accuracy of content of the HM Land Registry data and Rightmove does not accept any liability for error or omission. If you have found an error with the data or need further information please contact HM Land Registry.
Permitted Use: Viewers of this Information are granted permission to access this Crown copyright material and to download it onto electronic, magnetic, optical or similar storage media provided that such activities are for private research, study or in-house use only. Any other use of the material requires the formal written permission of Land Registry which can be requested from us, and is subject to an additional licence and associated charge.
Rightmove takes no liability for your use of, or reliance on, Rightmove's Instant Valuation due to the limitations of our tracking tool listed here. Use of this tool is taken entirely at your own risk. All rights reserved.