
House Prices in Waygateshaw
House prices in Waygateshaw have an overall average of £189,515 over the last year.
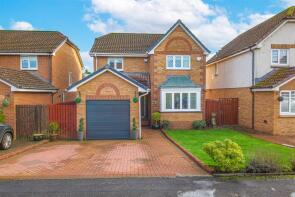
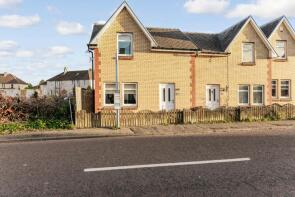
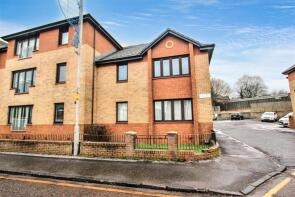
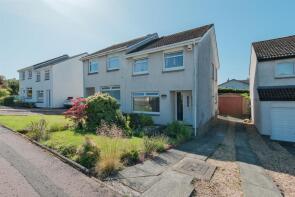
The majority of properties sold in Waygateshaw during the last year were semi-detached properties, selling for an average price of £176,086. Detached properties sold for an average of £288,919, with flats fetching £86,920.
Overall, the historical sold prices in Waygateshaw over the last year were 11% down on the previous year and 36% down on the 2009 peak of £296,005.
Properties Sold
38, Cooper Avenue, Carluke ML8 5US
| Today | See what it's worth now |
| 30 Apr 2026 | £200,000 |
| 10 Jul 2006 | £122,000 |
No other historical records.
9, South Avenue, Carluke ML8 5TW

| Today | See what it's worth now |
| 24 Apr 2026 | £68,000 |
| 29 Jun 2017 | £50,000 |
13, Moss Side Avenue, Carluke ML8 5UG
| Today | See what it's worth now |
| 17 Apr 2026 | £145,500 |
| 6 Nov 2003 | £60,000 |
No other historical records.
25, Castlehill Crescent, Law, Carluke ML8 5LY

| Today | See what it's worth now |
| 16 Apr 2026 | £97,000 |
| 6 Feb 2007 | £67,000 |
3, Hamburg Cottages, Lawhill Road, Law, Carluke ML8 5HF

| Today | See what it's worth now |
| 16 Apr 2026 | £170,000 |
| 4 Feb 2025 | £145,000 |
24, Ashfield Road, Law, Carluke ML8 5JW
| Today | See what it's worth now |
| 8 Apr 2026 | £110,000 |
| 4 Dec 2013 | £23,600 |
No other historical records.
22, Braefoot Crescent, Law, Carluke ML8 5SH
| Today | See what it's worth now |
| 2 Apr 2026 | £255,000 |
| 1 Dec 2014 | £176,000 |
No other historical records.
30, Cooper Avenue, Carluke ML8 5US
| Today | See what it's worth now |
| 31 Mar 2026 | £295,000 |
No other historical records.
56a, Station Road, Law, Carluke ML8 5LW
| Today | See what it's worth now |
| 30 Mar 2026 | £112,500 |
| 2 Jul 2019 | £78,750 |
2, Stewart Place, Carluke ML8 5SR
| Today | See what it's worth now |
| 24 Mar 2026 | £82,000 |
| 19 Aug 2002 | £23,000 |
No other historical records.
11, Whiteshaw Avenue, Carluke ML8 5DF
| Today | See what it's worth now |
| 24 Mar 2026 | £160,000 |
No other historical records.
15, North Avenue, Carluke ML8 5TR
| Today | See what it's worth now |
| 19 Mar 2026 | £107,000 |
No other historical records.
1, High Street, Carluke ML8 4AL
| Today | See what it's worth now |
| 16 Mar 2026 | £30,000 |
| 13 Feb 2026 | £39,999 |
20, Mcintosh Gardens, Law, Carluke ML8 5FN
| Today | See what it's worth now |
| 11 Mar 2026 | £265,000 |
| 26 Sep 2022 | £235,995 |
No other historical records.
28, South Avenue, Carluke ML8 5TW
| Today | See what it's worth now |
| 10 Mar 2026 | £28,500 |
| 22 Nov 2021 | £22,500 |
Manse, Lanark Road, Crossford, Carluke ML8 5RE
| Today | See what it's worth now |
| 10 Mar 2026 | £320,000 |
No other historical records.
6, 41c Kirkton, Station Road, Carluke ML8 5AD
| Today | See what it's worth now |
| 9 Mar 2026 | £173,000 |
| 10 Nov 2020 | £150,000 |
4, Kirkton, Station Road, Carluke ML8 5AD
| Today | See what it's worth now |
| 5 Mar 2026 | £160,000 |
| 27 May 2008 | £150,000 |
No other historical records.
39, Whitehill Crescent, Carluke ML8 5DU
| Today | See what it's worth now |
| 2 Mar 2026 | £50,000 |
| 27 Jun 2006 | £20,240 |
No other historical records.
44, Pegasus Avenue, Carluke ML8 5TN
| Today | See what it's worth now |
| 26 Feb 2026 | £152,500 |
No other historical records.
69, Stewart Street, Carluke ML8 5BY
| Today | See what it's worth now |
| 25 Feb 2026 | £125,000 |
| 15 May 2024 | £115,000 |
32, Hyndshaw View, Law, Carluke ML8 5JX
| Today | See what it's worth now |
| 23 Feb 2026 | £168,000 |
| 10 Aug 2018 | £116,000 |
No other historical records.
16, Brownlee Road, Law, Carluke ML8 5JD
| Today | See what it's worth now |
| 19 Feb 2026 | £125,000 |
| 7 Jun 2021 | £95,000 |
No other historical records.
Source Acknowledgement: © Crown copyright. Scottish house price data is publicly available information produced by the Registers of Scotland. Material has been reproduced with the permission of the Keeper of the Registers of Scotland and contains data compiled by Registers of Scotland. For further information, please contact data@ros.gov.uk. Please note the dates shown here relate to the property's registered date not sold date.This material was last updated on 10 July 2026. It covers the period from 8 December 1987 to 30 April 2026 and contains property transactions which have been registered during that period.
Disclaimer: Rightmove.co.uk provides this Registers of Scotland data "as is". The burden for fitness of the data relies completely with the user and is provided for informational purposes only. No warranty, express or implied, is given relating to the accuracy of content of the Registers of Scotland data and Rightmove plc does not accept any liability for error or omission. If you have found an error with the data or need further information please contact data@ros.gov.uk
Permitted Use: The Registers of Scotland allows the reproduction of the data which it provides to Rightmove.co.uk free of charge in any format or medium only for research, private study or for internal circulation within an organisation. This is subject to it being reproduced accurately and not used in a misleading context. The material must be acknowledged as Crown Copyright. You are not allowed to use this information for commercial purposes, nor must you copy, distribute, sell or publish the data in any way. For any other use of this material, please apply to the Registers of Scotland for a licence. You can do this online at www.ros.gov.uk, by email at data@ros.gov.uk or by writing to Business Development, Registers of Scotland, Meadowbank House, 153 London Road, Edinburgh EH8 7AU.
Rightmove takes no liability for your use of, or reliance on, Rightmove's Instant Valuation due to the limitations of our tracking tool listed here. Use of this tool is taken entirely at your own risk. All rights reserved.