
House Prices in West Byfleet
House prices in West Byfleet have an overall average of £623,512 over the last year.
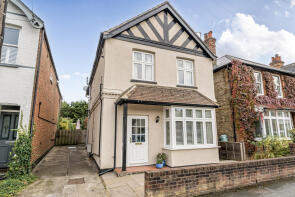
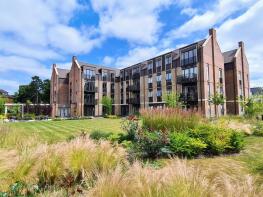
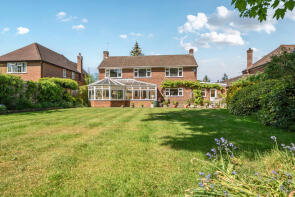
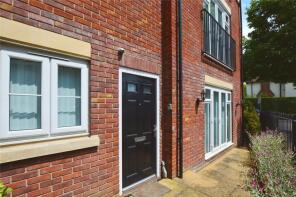
The majority of properties sold in West Byfleet during the last year were detached properties, selling for an average price of £950,946. Flats sold for an average of £311,292, with semi-detached properties fetching £507,364.
Overall, the historical sold prices in West Byfleet over the last year were 8% down on the previous year and 32% down on the 2023 peak of £914,828.
Properties Sold
34 Bradenstoke, Station Road, West Byfleet KT14 6DR
| Today | See what it's worth now |
| 27 Mar 2026 | £690,000 |
| 12 Aug 1999 | £185,000 |
No other historical records.
Apartment 11 West Wing, Sherwood Manor, Hobbs Close, West Byfleet KT14 6FF
| Today | See what it's worth now |
| 27 Mar 2026 | £525,000 |
| 11 Apr 2024 | £631,750 |
No other historical records.
Linden, Blackwood Close, West Byfleet KT14 6PP
| Today | See what it's worth now |
| 20 Mar 2026 | £940,000 |
No other historical records.
22, Rosemount Point, Rosemount Avenue, West Byfleet KT14 6BD
| Today | See what it's worth now |
| 18 Mar 2026 | £340,000 |
| 12 Nov 2009 | £275,000 |
No other historical records.
63, Camphill Road, West Byfleet KT14 6EE
| Today | See what it's worth now |
| 13 Mar 2026 | £545,000 |
| 1 Oct 2014 | £405,000 |
Ty Gwynant, The Close, West Byfleet KT14 6HR

| Today | See what it's worth now |
| 2 Mar 2026 | £730,000 |
No other historical records.
12, Briar Walk, West Byfleet KT14 6JS
| Today | See what it's worth now |
| 25 Feb 2026 | £280,000 |
| 28 Feb 2020 | £270,000 |
Fairstow, Coldharbour Road, West Byfleet KT14 6JL
| Today | See what it's worth now |
| 11 Feb 2026 | £537,500 |
| 11 Aug 2011 | £800,000 |
Qila, Woodlands Avenue, West Byfleet KT14 6AP
| Today | See what it's worth now |
| 2 Feb 2026 | £450,000 |
No other historical records.
55, Birchwood Road, West Byfleet KT14 6DP
| Today | See what it's worth now |
| 29 Jan 2026 | £420,000 |
| 29 Feb 2008 | £275,000 |
Flat 4, 13 Parkside House, Camphill Road, West Byfleet KT14 6EG
| Today | See what it's worth now |
| 28 Jan 2026 | £355,000 |
| 28 Jul 2022 | £350,000 |
1, Drayton Court, West Byfleet KT14 6NB
| Today | See what it's worth now |
| 16 Jan 2026 | £250,000 |
| 19 Aug 2022 | £250,000 |
Halladay House, Dartnell Park Road, West Byfleet KT14 6PX
| Today | See what it's worth now |
| 7 Jan 2026 | £1,090,000 |
No other historical records.
6, 13 15 The Courtyard, Claremont Road, West Byfleet KT14 6BQ
| Today | See what it's worth now |
| 19 Dec 2025 | £365,000 |
| 29 Sep 1999 | £130,000 |
No other historical records.
Flat 1, Wentworth House, Pyrford Road, West Byfleet KT14 6LD
| Today | See what it's worth now |
| 19 Dec 2025 | £430,000 |
| 24 Nov 2014 | £415,000 |
No other historical records.
42, Lambourne Crescent, Sheerwater, Woking GU21 5RQ

| Today | See what it's worth now |
| 17 Dec 2025 | £410,000 |
| 8 Jul 2016 | £294,500 |
No other historical records.
Flat 27, Magna West, Lavender Park Road, West Byfleet KT14 6FD
| Today | See what it's worth now |
| 17 Dec 2025 | £360,000 |
| 4 Dec 2020 | £374,950 |
No other historical records.
6, Blenheim Close, West Byfleet KT14 6ER
| Today | See what it's worth now |
| 16 Dec 2025 | £435,000 |
| 7 Sep 2015 | £380,000 |
100, Station Road, West Byfleet KT14 6DX
| Today | See what it's worth now |
| 11 Dec 2025 | £600,000 |
| 27 Mar 2018 | £455,000 |
21, Birchwood Drive, West Byfleet KT14 6DS
| Today | See what it's worth now |
| 8 Dec 2025 | £740,000 |
| 9 Jun 2017 | £599,250 |
1, Cheniston Close, West Byfleet KT14 6DQ

| Today | See what it's worth now |
| 5 Dec 2025 | £485,000 |
| 24 Nov 2011 | £324,400 |
No other historical records.
2, 13 15 The Courtyard, Claremont Road, West Byfleet KT14 6BQ
| Today | See what it's worth now |
| 5 Dec 2025 | £237,500 |
| 1 Jul 1999 | £90,000 |
No other historical records.
Flat 1, Lingcroft, Pyrford Road, West Byfleet KT14 6QS

| Today | See what it's worth now |
| 5 Dec 2025 | £680,000 |
| 11 Jul 2025 | £400,000 |
Source Acknowledgement: © Crown copyright. England and Wales house price data is publicly available information produced by the HM Land Registry.This material was last updated on 9 July 2026. It covers the period from 1 January 1995 to 30 April 2026 and contains property transactions which have been registered during that period. Contains HM Land Registry data © Crown copyright and database right 2026. This data is licensed under the Open Government Licence v3.0.
Disclaimer: Rightmove.co.uk provides this HM Land Registry data "as is". The burden for fitness of the data relies completely with the user and is provided for informational purposes only. No warranty, express or implied, is given relating to the accuracy of content of the HM Land Registry data and Rightmove does not accept any liability for error or omission. If you have found an error with the data or need further information please contact HM Land Registry.
Permitted Use: Viewers of this Information are granted permission to access this Crown copyright material and to download it onto electronic, magnetic, optical or similar storage media provided that such activities are for private research, study or in-house use only. Any other use of the material requires the formal written permission of Land Registry which can be requested from us, and is subject to an additional licence and associated charge.
Rightmove takes no liability for your use of, or reliance on, Rightmove's Instant Valuation due to the limitations of our tracking tool listed here. Use of this tool is taken entirely at your own risk. All rights reserved.