
House Prices in Whyke
House prices in Whyke have an overall average of £381,058 over the last year.
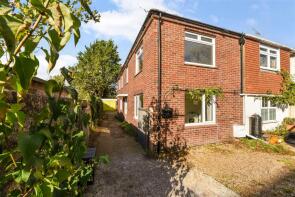
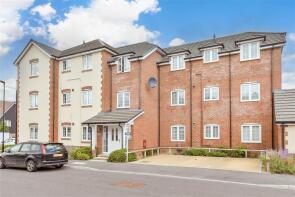
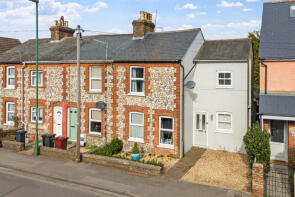
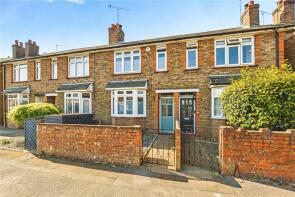
The majority of properties sold in Whyke during the last year were terraced properties, selling for an average price of £336,421. Semi-detached properties sold for an average of £399,388, with flats fetching £229,444.
Overall, the historical sold prices in Whyke over the last year were 8% up on the previous year and 2% up on the 2022 peak of £374,319.
Properties Sold
1, Lake Road, Chichester PO19 7TD
| Today | See what it's worth now |
| 23 Mar 2026 | £362,500 |
| 5 Jul 2019 | £340,000 |
No other historical records.
3, Richard Road, Chichester PO19 7DF
| Today | See what it's worth now |
| 13 Mar 2026 | £272,000 |
| 28 Feb 2022 | £262,995 |
No other historical records.
33, Kingsham Avenue, Chichester PO19 8AW
| Today | See what it's worth now |
| 6 Mar 2026 | £430,000 |
| 9 Nov 2001 | £153,000 |
No other historical records.
14, Cambrai Avenue, Chichester PO19 7PB
| Today | See what it's worth now |
| 6 Mar 2026 | £380,000 |
| 31 May 2024 | £368,500 |
43, Caernarvon Road, Chichester PO19 7YE
| Today | See what it's worth now |
| 20 Feb 2026 | £315,000 |
| 22 Jan 2021 | £257,000 |
3, Kingsham Avenue, Chichester PO19 8AW
| Today | See what it's worth now |
| 19 Feb 2026 | £350,000 |
No other historical records.
24, Cherry Orchard Road, Chichester PO19 8BZ
| Today | See what it's worth now |
| 13 Feb 2026 | £335,000 |
| 24 Oct 2014 | £110,000 |
No other historical records.
5, 77a Minerva Place, Whyke Lane, Chichester PO19 7PD
| Today | See what it's worth now |
| 13 Feb 2026 | £192,000 |
| 26 Jan 2024 | £180,500 |
75, Whyke Lane, Chichester PO19 7PD

| Today | See what it's worth now |
| 5 Feb 2026 | £456,000 |
| 2 Mar 2012 | £295,000 |
1, 77a Minerva Place, Whyke Lane, Chichester PO19 7PD

| Today | See what it's worth now |
| 23 Jan 2026 | £210,000 |
| 9 Nov 2020 | £175,000 |
122, Bognor Road, Chichester PO19 7TH
| Today | See what it's worth now |
| 22 Jan 2026 | £420,000 |
| 17 Feb 2017 | £285,000 |
3, Nursery Gardens, Kingsham Avenue, Chichester PO19 8EX
| Today | See what it's worth now |
| 16 Jan 2026 | £330,000 |
| 7 Jan 2013 | £230,000 |
Flat 1, Bayton Court, Velyn Avenue, Chichester PO19 7PA
| Today | See what it's worth now |
| 15 Jan 2026 | £210,000 |
| 8 Jul 2020 | £194,000 |
97, Chatsworth Road, Chichester PO19 7YJ

| Today | See what it's worth now |
| 15 Dec 2025 | £275,000 |
| 31 Jan 2019 | £235,000 |
2, Parham Close, Chichester PO19 7BL

| Today | See what it's worth now |
| 8 Dec 2025 | £345,000 |
| 27 Feb 2004 | £239,500 |
No other historical records.
91, Charles Avenue, Chichester PO19 7HE
| Today | See what it's worth now |
| 20 Nov 2025 | £255,000 |
| 18 Oct 2019 | £230,000 |
72, The Hornet, Chichester PO19 7JJ
| Today | See what it's worth now |
| 10 Nov 2025 | £220,000 |
| 26 Feb 2016 | £205,000 |
61, Grove Road, Chichester PO19 8AP
| Today | See what it's worth now |
| 29 Oct 2025 | £350,000 |
| 21 Sep 2001 | £122,000 |
No other historical records.
26, Buckingham Drive, Chichester PO19 7XP
| Today | See what it's worth now |
| 21 Oct 2025 | £250,000 |
| 6 Jul 2010 | £160,000 |
No other historical records.
138, Whyke Road, Chichester PO19 8HT
| Today | See what it's worth now |
| 20 Oct 2025 | £550,000 |
| 16 Nov 2020 | £399,950 |
No other historical records.
22, Eastland Road, Chichester PO19 8AZ
| Today | See what it's worth now |
| 20 Oct 2025 | £300,000 |
| 20 Apr 2001 | £89,950 |
No other historical records.
53, York Road, Chichester PO19 7TL
| Today | See what it's worth now |
| 17 Oct 2025 | £465,000 |
| 9 Nov 2018 | £430,000 |
16, Winden Avenue, Chichester PO19 7UZ
| Today | See what it's worth now |
| 10 Oct 2025 | £300,000 |
No other historical records.
Source Acknowledgement: © Crown copyright. England and Wales house price data is publicly available information produced by the HM Land Registry.This material was last updated on 15 May 2026. It covers the period from 1 January 1995 to 31 March 2026 and contains property transactions which have been registered during that period. Contains HM Land Registry data © Crown copyright and database right 2026. This data is licensed under the Open Government Licence v3.0.
Disclaimer: Rightmove.co.uk provides this HM Land Registry data "as is". The burden for fitness of the data relies completely with the user and is provided for informational purposes only. No warranty, express or implied, is given relating to the accuracy of content of the HM Land Registry data and Rightmove does not accept any liability for error or omission. If you have found an error with the data or need further information please contact HM Land Registry.
Permitted Use: Viewers of this Information are granted permission to access this Crown copyright material and to download it onto electronic, magnetic, optical or similar storage media provided that such activities are for private research, study or in-house use only. Any other use of the material requires the formal written permission of Land Registry which can be requested from us, and is subject to an additional licence and associated charge.
Rightmove takes no liability for your use of, or reliance on, Rightmove's Instant Valuation due to the limitations of our tracking tool listed here. Use of this tool is taken entirely at your own risk. All rights reserved.